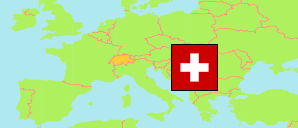
Maggia
in Distretto di Vallemaggia (Ticino)
Contents: Commune
The population development of Maggia as well as related information and services (weather, Wikipedia, Google, images).
| Name | District | Population Census 1980-12-02 | Population Census 1990-12-04 | Population Census 2000-12-05 | Population Estimate 2010-12-31 | Population Estimate 2020-12-31 | Population Estimate 2024-12-31 | |
|---|---|---|---|---|---|---|---|---|
| Maggia | Distretto di Vallemaggia | 1,687 | 2,067 | 2,281 | 2,447 | 2,611 | 2,674 | → |
Source: Swiss Federal Statistical Office.
Explanation: Districts and communes in the boundaries of December 2024. The population figures for 2024 are final.
Further information about the population structure:
| Gender (E 2024) | |
|---|---|
| Males | 1,313 |
| Females | 1,361 |
| Age Groups (E 2024) | |
|---|---|
| 0-17 years | 461 |
| 18-64 years | 1,541 |
| 65+ years | 672 |
| Age Distribution (E 2024) | |
|---|---|
| 90+ years | 41 |
| 80-89 years | 145 |
| 70-79 years | 324 |
| 60-69 years | 372 |
| 50-59 years | 398 |
| 40-49 years | 351 |
| 30-39 years | 305 |
| 20-29 years | 240 |
| 10-19 years | 234 |
| 0-9 years | 264 |
| Citizenship (E 2024) | |
|---|---|
| Switzerland | 2,397 |
| Germany | 12 |
| France | 1 |
| Italy | 173 |
| Portugal | 20 |
| EU (others) | 35 |
| Europe (non-EU countries) | 9 |
| Africa | 7 |
| Asia | 7 |
| Other Citizenship | 13 |
| Country of Birth (E 2024) | |
|---|---|
| Switzerland | 2,234 |
| Other country | 440 |
