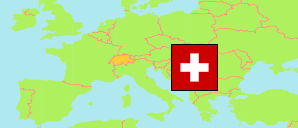
Wahlkreis Rheintal
District in St. Gallen
District
The population development of Wahlkreis Rheintal.
| Name | Status | Population Census 1980-12-02 | Population Census 1990-12-04 | Population Census 2000-12-05 | Population Estimate 2010-12-31 | Population Estimate 2020-12-31 | Population Estimate 2023-12-31 | |
|---|---|---|---|---|---|---|---|---|
| Wahlkreis Rheintal | District | 50,927 | 55,676 | 61,644 | 67,509 | 74,372 | 77,971 | → |
| St. Gallen | Canton | 391,995 | 427,501 | 452,837 | 478,907 | 514,504 | 535,047 |
Contents: Cities and Communes
The population development of the cities and communes in Wahlkreis Rheintal.
| Name | Status | District | Population Census 1980-12-02 | Population Census 1990-12-04 | Population Census 2000-12-05 | Population Estimate 2010-12-31 | Population Estimate 2020-12-31 | Population Estimate 2023-12-31 | |
|---|---|---|---|---|---|---|---|---|---|
| Altstätten | City | Wahlkreis Rheintal | 9,260 | 10,249 | 10,381 | 10,819 | 11,938 | 12,453 | → |
| Au (SG) | Commune | Wahlkreis Rheintal | 5,434 | 5,778 | 6,409 | 6,993 | 7,984 | 8,480 | → |
| Balgach | Commune | Wahlkreis Rheintal | 3,122 | 3,538 | 4,024 | 4,406 | 4,942 | 5,138 | → |
| Berneck | Commune | Wahlkreis Rheintal | 2,793 | 3,087 | 3,289 | 3,692 | 3,928 | 3,989 | → |
| Diepoldsau | Commune | Wahlkreis Rheintal | 3,562 | 4,148 | 5,034 | 5,832 | 6,479 | 6,928 | → |
| Eichberg | Commune | Wahlkreis Rheintal | 719 | 968 | 1,266 | 1,435 | 1,554 | 1,571 | → |
| Marbach (SG) | Commune | Wahlkreis Rheintal | 1,382 | 1,521 | 1,779 | 2,014 | 2,139 | 2,118 | → |
| Oberriet (SG) | Commune | Wahlkreis Rheintal | 6,222 | 6,647 | 7,454 | 8,314 | 8,996 | 9,290 | → |
| Rebstein | Commune | Wahlkreis Rheintal | 3,127 | 3,510 | 4,055 | 4,294 | 4,640 | 5,051 | → |
| Rheineck | City | Wahlkreis Rheintal | 3,037 | 3,101 | 3,231 | 3,325 | 3,404 | 3,516 | → |
| Rüthi (SG) | Commune | Wahlkreis Rheintal | 1,475 | 1,677 | 1,967 | 2,046 | 2,445 | 2,542 | → |
| St. Margrethen | Commune | Wahlkreis Rheintal | 4,935 | 5,278 | 5,285 | 5,568 | 5,991 | 6,558 | → |
| Widnau | Commune | Wahlkreis Rheintal | 5,859 | 6,174 | 7,470 | 8,771 | 9,932 | 10,337 | → |
Source: Swiss Federal Statistical Office.
Explanation: Districts and communes in the boundaries of December 2023. The population figures for 2023 are preliminary.