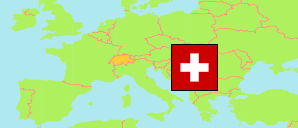
Glarus
in Glarus (Glarus)
Contents: Commune
The population development of Glarus as well as related information and services (weather, Wikipedia, Google, images).
| Name | Population Census 1980-12-02 | Population Census 1990-12-04 | Population Census 2000-12-05 | Population Estimate 2010-12-31 | Population Estimate 2020-12-31 | Population Estimate 2024-12-31 | |
|---|---|---|---|---|---|---|---|
| Glarus (incl. Ennenda, Netstal) | 11,781 | 12,139 | 11,799 | 12,170 | 12,539 | 12,880 | → |
Source: Swiss Federal Statistical Office.
Explanation: Districts and communes in the boundaries of December 2024. The population figures for 2024 are preliminary.
Further information about the population structure:
| Gender (E 2023) | |
|---|---|
| Males | 6,368 |
| Females | 6,390 |
| Age Groups (E 2023) | |
|---|---|
| 0-17 years | 2,225 |
| 18-64 years | 7,887 |
| 65+ years | 2,646 |
| Age Distribution (E 2023) | |
|---|---|
| 90+ years | 161 |
| 80-89 years | 603 |
| 70-79 years | 1,139 |
| 60-69 years | 1,610 |
| 50-59 years | 1,824 |
| 40-49 years | 1,686 |
| 30-39 years | 1,729 |
| 20-29 years | 1,519 |
| 10-19 years | 1,260 |
| 0-9 years | 1,227 |
| Citizenship (E 2023) | |
|---|---|
| Switzerland | 9,013 |
| Germany | 424 |
| France | 5 |
| Italy | 678 |
| Portugal | 450 |
| EU (others) | 508 |
| Europe (non-EU countries) | 1,094 |
| Africa | 166 |
| Asia | 360 |
| Other country | 57 |
| Country of Birth (E 2023) | |
|---|---|
| Switzerland | 9,128 |
| Other country | 3,630 |
