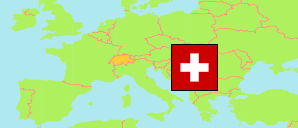
Glarus
Agglomeration in Switzerland
Contents: Population
The population development of Glarus as well as related information and services (Wikipedia, Google, images).
| Name | Status | Cantons | Population Census 1980-12-02 | Population Census 1990-12-04 | Population Census 2000-12-05 | Population Estimate 2010-12-31 | Population Estimate 2020-12-31 | Population Estimate 2024-12-31 | |
|---|---|---|---|---|---|---|---|---|---|
| Glarus | Agglomeration | Glarus | 26,169 | 27,450 | 27,571 | 28,788 | 31,371 | 32,696 |
Source: Swiss Federal Statistical Office.
Explanation: Boundaries of agglomerations (core and belt) according to the 2012 definition without parts outside of Switzerland. The population figures for 2024 are final.
Further information about the population structure:
| Gender (E 2024) | |
|---|---|
| Males | 16,483 |
| Females | 16,213 |
| Age Groups (E 2024) | |
|---|---|
| 0-17 years | 5,909 |
| 18-64 years | 20,264 |
| 65+ years | 6,523 |
| Age Distribution (E 2024) | |
|---|---|
| 90+ years | 328 |
| 80-89 years | 1,492 |
| 70-79 years | 2,831 |
| 60-69 years | 4,080 |
| 50-59 years | 4,445 |
| 40-49 years | 4,553 |
| 30-39 years | 4,746 |
| 20-29 years | 3,649 |
| 10-19 years | 3,283 |
| 0-9 years | 3,289 |
| Citizenship (E 2024) | |
|---|---|
| Switzerland | 23,305 |
| Germany | 1,109 |
| France | 23 |
| Italy | 1,597 |
| Portugal | 1,104 |
| EU (others) | 1,618 |
| Europe (non-EU countries) | 2,675 |
| Africa | 311 |
| Asia | 797 |
| Other Citizenship | 152 |
| Country of Birth (E 2024) | |
|---|---|
| Switzerland | 23,410 |
| Other country | 9,286 |