
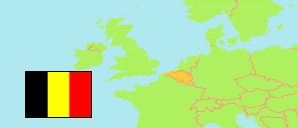
Turnhout
Arrondissement in Antwerpen
Arrondissement
The population development of Turnhout.
| Name | Status | Population Census 1970-12-31 | Population Census 1981-03-01 | Population Census 1991-03-01 | Population Estimate 2001-01-01 | Population Census 2011-01-01 | Population Estimate 2016-01-01 | Population Census 2021-01-01 | Population Estimate 2026-01-01 | |
|---|---|---|---|---|---|---|---|---|---|---|
| Turnhout | Arrondissement | 332,728 | 359,407 | 383,179 | 407,672 | 435,219 | 453,123 | 467,146 | 485,368 | → |
| Antwerpen [Antwerp] | Province | 1,521,726 | 1,553,337 | 1,586,928 | 1,627,908 | 1,746,121 | 1,805,179 | 1,856,261 | 1,931,891 |
Contents: Cities and Municipalities
The population development of the cities and municipalities in Turnhout.
 icon links to further information about a selected place including its population structure (gender, age groups, age distribution, citizenship).
| Name | Status | Arrondissement | Population Census 1970-12-31 | Population Census 1981-03-01 | Population Census 1991-03-01 | Population Estimate 2001-01-01 | Population Census 2011-01-01 | Population Estimate 2016-01-01 | Population Census 2021-01-01 | Population Estimate 2026-01-01 | |
|---|---|---|---|---|---|---|---|---|---|---|---|
| Arendonk | Municipality | Turnhout | 9,895 | 10,561 | 11,127 | 11,883 | 12,869 | 13,142 | 13,207 | 13,426 | → |
| Baarle-Hertog (Baerle-Duc) | Municipality | Turnhout | 2,146 | 2,111 | 2,126 | 2,156 | 2,594 | 2,663 | 2,935 | 3,103 | → |
| Balen | Municipality | Turnhout | 17,635 | 18,162 | 18,678 | 19,410 | 21,303 | 22,168 | 22,853 | 23,916 | → |
| Beerse | Municipality | Turnhout | 11,197 | 12,786 | 14,018 | 15,850 | 17,033 | 17,829 | 18,194 | 18,780 | → |
| Dessel | Municipality | Turnhout | 7,505 | 8,074 | 8,284 | 8,489 | 9,177 | 9,420 | 9,659 | 10,191 | → |
| Geel | Municipality | Turnhout | 29,664 | 31,463 | 32,487 | 33,879 | 37,483 | 39,225 | 40,781 | 42,650 | → |
| Grobbendonk | Municipality | Turnhout | 7,568 | 8,625 | 9,691 | 10,483 | 11,050 | 11,204 | 11,249 | 11,608 | → |
| Herentals | Municipality | Turnhout | 23,111 | 23,797 | 24,500 | 25,582 | 27,122 | 27,728 | 28,194 | 29,163 | → |
| Herenthout | Municipality | Turnhout | 6,773 | 7,199 | 7,840 | 8,315 | 8,723 | 8,806 | 9,185 | 9,464 | → |
| Herselt | Municipality | Turnhout | 10,938 | 11,340 | 12,730 | 13,653 | 14,387 | 14,491 | 14,649 | 14,777 | → |
| Hoogstraten | Municipality | Turnhout | 13,503 | 14,368 | 15,778 | 17,870 | 20,052 | 21,183 | 21,560 | 22,525 | → |
| Hulshout | Municipality | Turnhout | 6,712 | 7,056 | 7,521 | 8,690 | 9,970 | 10,255 | 10,553 | 10,652 | → |
| Kasterlee | Municipality | Turnhout | 12,218 | 14,612 | 16,246 | 17,633 | 18,137 | 18,331 | 19,052 | 19,835 | → |
| Laakdal | Municipality | Turnhout | 12,120 | 13,297 | 14,221 | 14,801 | 15,430 | 15,851 | 16,293 | 17,032 | → |
| Lille | Municipality | Turnhout | 10,318 | 12,002 | 13,733 | 15,107 | 16,391 | 16,404 | 16,517 | 17,175 | → |
| Meerhout | Municipality | Turnhout | 8,567 | 8,613 | 9,141 | 9,204 | 9,804 | 10,162 | 10,279 | 10,365 | → |
| Merksplas | Municipality | Turnhout | 5,065 | 6,136 | 7,219 | 8,058 | 8,559 | 8,642 | 8,616 | 8,974 | → |
| Mol | Municipality | Turnhout | 28,823 | 29,798 | 30,763 | 31,766 | 34,446 | 36,034 | 37,021 | 38,793 | → |
| Olen | Municipality | Turnhout | 8,138 | 9,255 | 10,362 | 10,920 | 11,782 | 12,242 | 12,600 | 12,945 | → |
| Oud-Turnhout | Municipality | Turnhout | 8,207 | 10,733 | 11,589 | 12,444 | 12,915 | 13,307 | 14,201 | 15,211 | → |
| Ravels | Municipality | Turnhout | 9,533 | 10,328 | 11,552 | 13,138 | 14,440 | 14,735 | 15,104 | 15,953 | → |
| Retie | Municipality | Turnhout | 7,640 | 8,359 | 9,059 | 9,797 | 10,806 | 11,096 | 11,582 | 12,076 | → |
| Rijkevorsel | Municipality | Turnhout | 8,327 | 8,985 | 9,718 | 10,482 | 11,271 | 11,823 | 12,262 | 12,552 | → |
| Turnhout | Municipality | Turnhout | 38,007 | 37,453 | 37,874 | 38,714 | 41,264 | 42,965 | 45,874 | 48,490 | → |
| Vorselaar | Municipality | Turnhout | 5,506 | 6,215 | 6,865 | 7,352 | 7,558 | 7,777 | 7,995 | 8,056 | → |
| Vosselaar | Municipality | Turnhout | 7,148 | 8,620 | 9,450 | 9,972 | 10,475 | 10,935 | 11,443 | 11,933 | → |
| Westerlo | Municipality | Turnhout | 16,464 | 19,459 | 20,607 | 22,024 | 24,198 | 24,705 | 25,288 | 25,723 | → |
Source: Statistics Belgium.
Further information about the population structure:
| Gender (E 2026) | |
|---|---|
| Males | 243,040 |
| Females | 242,328 |
| Age Groups (E 2026) | |
|---|---|
| 0-17 years | 88,795 |
| 18-64 years | 285,674 |
| 65+ years | 110,899 |
| Age Distribution (E 2026) | |
|---|---|
| 90+ years | 5,359 |
| 80-89 years | 24,092 |
| 70-79 years | 48,724 |
| 60-69 years | 69,150 |
| 50-59 years | 64,757 |
| 40-49 years | 62,271 |
| 30-39 years | 59,570 |
| 20-29 years | 51,878 |
| 10-19 years | 53,880 |
| 0-9 years | 45,687 |
| Citizenship (E 2026) | |
|---|---|
| Belgium | 425,576 |
| Other Citizenship | 59,792 |