CITY POPULATION
Bevölkerungsstatistiken für Staaten, Verwaltungsgebiete, Städte und Agglomerationen – interaktive Karten, Diagramme und Tabellen
-

Beliebte Länderseiten


-

Agglomerationen
Alle urbanen Agglomerationen der Welt mit mindestens 1 Million Einwohnern.
Bezugsdatum: 2026-01-01
-

Top 10 Cities
Die zehn bevölkerungsreichsten Städte ausgewählter Staaten und ihrer Verwaltungseinheiten (englisch).
-
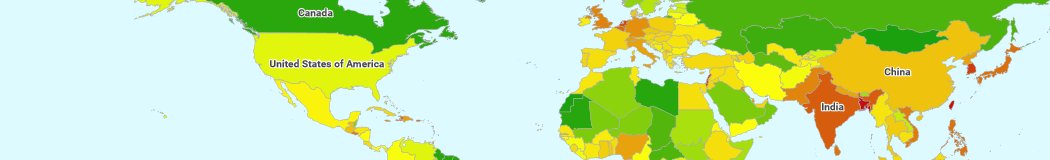
World by Map
Statistiken und Ranglisten zu verschiedenen Themen mit Karten und Diagrammen (englisch).