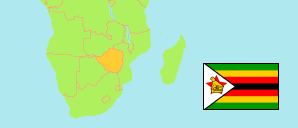
Manicaland
Province in Zimbabwe
Contents: Subdivision
The population development in Manicaland as well as related information and services (Wikipedia, Google, images).
| Name | Status | Population Census 2002-08-18 | Population Census 2012-08-17 | Population Census 2022-04-20 | |
|---|---|---|---|---|---|
| Manicaland | Province | 1,568,930 | 1,752,698 | 2,037,703 | |
| Buhera | District | 220,060 | 245,878 | 271,920 | → |
| Chimanimani | District | 115,297 | 134,940 | 153,619 | → |
| Chipinge Rural | District | 267,256 | 298,841 | 375,259 | → |
| Chipinge Urban | Urban District | 16,536 | 25,292 | 34,959 | → |
| Makoni | District | 247,993 | 272,340 | 288,441 | → |
| Mutare Rural | District | 222,383 | 262,124 | 306,760 | → |
| Mutare Urban | Urban District | 170,466 | 187,621 | 224,804 | → |
| Mutasa | District | 166,646 | 168,747 | 197,808 | → |
| Nyanga | District | 117,279 | 126,599 | 146,227 | → |
| Rusape | Urban District | 25,014 | 30,316 | 37,906 | → |
| Zimbabwe | Republic | 11,631,657 | 13,061,239 | 15,178,957 |
Source: Zimbabwe National Statistics Agency (web).
Explanation: Areas figures are computed by using geospatial data.
Further information about the population structure:
| Gender (C 2022) | |
|---|---|
| Males | 965,350 |
| Females | 1,072,353 |
| Age Groups (C 2012) | |
|---|---|
| 0-14 years | 770,321 |
| 15-64 years | 897,465 |
| 65+ years | 81,282 |
| Age Distribution (C 2012) | |
|---|---|
| 0-9 years | 525,540 |
| 10-19 years | 434,132 |
| 20-29 years | 276,026 |
| 30-39 years | 202,037 |
| 40-49 years | 109,941 |
| 50-59 years | 86,292 |
| 60-69 years | 59,147 |
| 70+ years | 55,953 |
| Urbanization (C 2012) | |
|---|---|
| Rural | 1,456,139 |
| Urban | 296,559 |