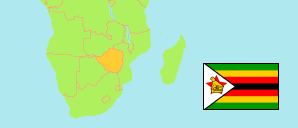
Mutare Urban
Urban District in Zimbabwe
Contents: Population
The population development of Mutare Urban as well as related information and services (Wikipedia, Google, images).
| Name | Status | Population Census 2002-08-18 | Population Census 2012-08-17 | Population Census 2022-04-20 | |
|---|---|---|---|---|---|
| Mutare Urban | Urban District | 170,466 | 187,621 | 224,804 | |
| Zimbabwe | Republic | 11,631,657 | 13,061,239 | 15,178,957 |
Source: Zimbabwe National Statistics Agency (web).
Explanation: Areas figures are computed by using geospatial data.
Further information about the population structure:
| Gender (C 2022) | |
|---|---|
| Males | 106,592 |
| Females | 118,212 |
| Age Groups (C 2012) | |
|---|---|
| 0-14 years | 67,558 |
| 15-64 years | 115,585 |
| 65+ years | 4,031 |
| Age Distribution (C 2012) | |
|---|---|
| 0-9 years | 47,941 |
| 10-19 years | 40,335 |
| 20-29 years | 41,577 |
| 30-39 years | 28,990 |
| 40-49 years | 14,350 |
| 50-59 years | 7,802 |
| 60-69 years | 3,598 |
| 70+ years | 2,581 |
| Urbanization (C 2012) | |
|---|---|
| Rural | 1,413 |
| Urban | 186,208 |