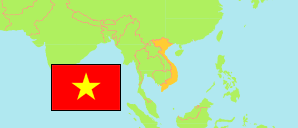
Cao Bằng
Province in Vietnam
Contents: Population
The population development in Cao Bằng as well as related information and services (Wikipedia, Google, images).
| Name | Status | Population Census 1999-04-01 | Population Census 2009-04-01 | Population Census 2019-04-01 | |
|---|---|---|---|---|---|
| Cao Bằng | Province | 490,335 | 507,183 | 530,341 | |
| Việt Nam [Vietnam] | Socialist Republic | 76,323,173 | 85,846,997 | 96,208,984 |
Source: General Statistics Office of Vietnam (web).
Further information about the population structure:
| Gender (C 2019) | |
|---|---|
| Males | 265,620 |
| Females | 264,721 |
| Age Groups (C 2019) | |
|---|---|
| 0-14 years | 139,212 |
| 15-64 years | 352,707 |
| 65+ years | 38,422 |
| Age Distribution (C 2019) | |
|---|---|
| 0-9 years | 97,964 |
| 10-19 years | 75,918 |
| 20-29 years | 83,578 |
| 30-39 years | 86,305 |
| 40-49 years | 67,615 |
| 50-59 years | 61,574 |
| 60-69 years | 30,519 |
| 70-79 years | 16,737 |
| 80+ years | 10,131 |
| Urbanization (C 2019) | |
|---|---|
| Rural | 406,934 |
| Urban | 123,407 |
| Ethnic Group (C 2019) | |
|---|---|
| Vietnamese (Kinh) | 27,143 |
| Other group | 503,198 |
