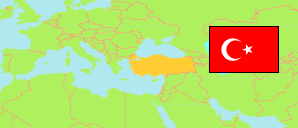
Mut
District in Mersin
District
The population development of Mut.
| Name | Status | Population Estimate 2009-12-31 | Population Estimate 2013-12-31 | Population Estimate 2017-12-31 | Population Estimate 2022-12-31 | |
|---|---|---|---|---|---|---|
| Mut | District | 63,673 | 62,693 | 62,228 | 62,874 | → |
| Mersin | Metropolitan Province | 1,640,888 | 1,705,774 | 1,793,931 | 1,916,432 |
Contents: Cities, Towns and Villages
The population development of the cities, towns and villages in Mut.
| Name | Status | District | Population Estimate 2009-12-31 | Population Estimate 2013-12-31 | Population Estimate 2017-12-31 | Population Estimate 2022-12-31 | |
|---|---|---|---|---|---|---|---|
| Aşağıköselerli | Neighborhood | Mut | 1,051 | 947 | 868 | 814 | → |
| Barabanlı | Neighborhood | Mut | 746 | 809 | 838 | 860 | → |
| Göksu | Neighborhood | Mut | 2,426 | 2,116 | 1,870 | 1,799 | → |
| Hamam | Neighborhood | Mut | 1,355 | 1,407 | 1,385 | 1,450 | → |
| Mut | City | Mut | 28,966 | 29,222 | 31,048 | 32,684 | → |
| Palantepe | Neighborhood | Mut | 643 | 706 | 800 | 812 | → |
| Sakız | Neighborhood | Mut | 1,062 | 1,033 | 1,014 | 999 | → |
| Yapıntı | Neighborhood | Mut | 1,037 | 1,085 | 1,009 | 943 | → |
Source: State Institute of Statistics, Republic of Türkiye.
Explanation: Since 2013, the population figures of cities in metropolitan provinces are calculated by using the population of selected neighborhoods.