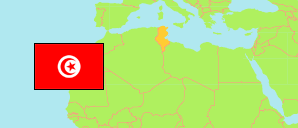
Sousse
Municipality in Sousse Agglomeration
Contents: Subdivision
The population development in Sousse as well as related information and services (Wikipedia, Google, images).
| Name | Status | Native | Population Census 2004-04-28 | Population Census 2014-04-23 | Population Census 2024-11-06 | |
|---|---|---|---|---|---|---|
| Sousse | Municipality | سوسة | 173,047 | 221,715 | 240,321 | |
| Ali Belhouan | Sector | علي البلهوان | 6,286 | 6,291 | 5,670 | → |
| Bou Hassina | Sector | بوحسينة | 13,584 | 15,852 | 16,282 | → |
| Bou Jâafer | Sector | بوجعفر | 6,717 | 8,161 | 8,283 | → |
| Cité Er Riadh | Sector | حي الرياض | 18,358 | 26,360 | 30,047 | → |
| El Medina | Sector | المدينة | 5,678 | 6,150 | 4,664 | → |
| Hached | Sector | حشاد | 8,825 | 10,415 | 11,397 | → |
| Hammem Maarouf Er-Riad (El Ahd El Jadid) | Sector | حمام معروف الرياض (العهد الجديد) | 16,089 | 20,763 | 22,828 | → |
| Hédi Chaker | Sector | الهادي شاكر | 10,720 | 16,814 | 19,801 | → |
| Ibn Khaldoun | Sector | إبن خلدون | 14,252 | 17,533 | 20,068 | → |
| Khezama | Sector | خزامة | 7,676 | 11,317 | 10,984 | → |
| Ksibet Ech Chatt | Sector | قصيبة الشط | 10,630 | 10,167 | 12,100 | → |
| Mohamed El Karoui | Sector | محمد القروي | 7,925 | 8,340 | 7,522 | → |
| Mohamed Mâarouf | Sector | محمد معروف | 3,323 | 3,369 | 2,619 | → |
| Oued Blibane | Sector | وادي بليبان | 21,609 | 18,346 | 17,217 | → |
| Sahloul | Sector | سهلول | ... | 16,750 | 25,316 | → |
| Sidi Abdelhamid | Sector | سيدي عبد الحميد | 2,783 | 4,242 | 4,772 | → |
| Taieb M'hiri | Sector | الطيب المهيري | 18,592 | 20,845 | 20,751 | → |
| Sousse | Urban Agglomeration | سوسة | 821,741 | 1,016,882 | 1,123,607 |
Source: Institut National de la Statistique Tunisie.
Explanation: Municipalities in 2020 boundaries. Area figures are computed using geospatial data.
Further information about the population structure:
| Gender (C 2024) | |
|---|---|
| Males | 116,485 |
| Females | 123,836 |
| Age Groups (C 2024) | |
|---|---|
| 0-14 years | 47,278 |
| 15-64 years | 168,988 |
| 65+ years | 24,055 |
| Age Distribution (C 2024) | |
|---|---|
| 80+ years | 3,534 |
| 70-79 years | 10,707 |
| 60-69 years | 22,571 |
| 50-59 years | 26,471 |
| 40-49 years | 33,919 |
| 30-39 years | 37,403 |
| 20-29 years | 41,071 |
| 10-19 years | 36,086 |
| 0-9 years | 28,559 |