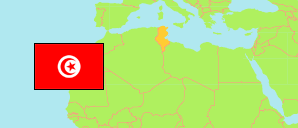
Sousse
Governorate in Tunisia
Contents: Subdivision
The population development in Sousse as well as related information and services (Wikipedia, Google, images).
| Name | Status | Native | Population Census 2004-04-28 | Population Census 2014-04-23 | Population Census 2024-11-06 | |
|---|---|---|---|---|---|---|
| Sousse | Governorate | سوسة | 544,413 | 674,971 | 762,281 | |
| Akouda | Delegation | اكودة | 25,717 | 34,494 | 39,174 | → |
| Bouficha | Delegation | بوفيشة | 23,581 | 26,763 | 36,094 | → |
| Enfida [Enfidha] | Delegation | النفيضة | 43,426 | 49,335 | 58,613 | → |
| Hammam Sousse | Delegation | حمام سوسة | 34,685 | 42,691 | 48,899 | → |
| Hergla | Delegation | هرقلة | 7,913 | 9,343 | 10,652 | → |
| Kalâa Kebira | Delegation | القلعة الكبرى | 51,196 | 59,132 | 67,108 | → |
| Kalâa Seghira | Delegation | القلعة الصغرى | 27,726 | 37,797 | 45,743 | → |
| Kondar | Delegation | كندار | 11,636 | 13,565 | 15,491 | → |
| M'saken | Delegation | مساكن | 85,380 | 97,225 | 97,312 | → |
| Sidi Bou Ali | Delegation | سيدي بوعلي | 17,606 | 19,693 | 20,647 | → |
| Sidi El Hani | Delegation | سيدي الهاني | 11,614 | 13,505 | 14,508 | → |
| Sousse Jawhara | Delegation | سوسة جوهرة | 62,663 | 86,517 | 97,535 | → |
| Sousse Médina | Delegation | سوسة المدينة | 29,680 | 35,288 | 32,220 | → |
| Sousse Riadh | Delegation | سوسة الرياض | 46,116 | 64,532 | 71,464 | → |
| Sousse Sidi Abdelhamid | Delegation | سوسة سيدي عبد الحميد | 46,257 | 52,787 | 57,691 | → |
| Zaouiet - Ksibet Thrayet | Delegation | الزاوية - القصيبة - الثريات | 19,217 | 32,304 | 49,130 | → |
| Tunisie [Tunisia] | Republic | تونس | 9,910,872 | 10,982,754 | 11,972,169 |
Source: Institut National de la Statistique Tunisie.
Explanation: Area figures are computed using geospatial data.
Further information about the population structure:
| Gender (C 2024) | |
|---|---|
| Males | 374,593 |
| Females | 387,688 |
| Age Groups (C 2024) | |
|---|---|
| 0-14 years | 170,526 |
| 15-64 years | 517,053 |
| 65+ years | 74,702 |
| Age Distribution (C 2024) | |
|---|---|
| 80+ years | 12,722 |
| 70-79 years | 32,207 |
| 60-69 years | 67,946 |
| 50-59 years | 85,604 |
| 40-49 years | 108,660 |
| 30-39 years | 112,811 |
| 20-29 years | 111,874 |
| 10-19 years | 126,073 |
| 0-9 years | 104,384 |
