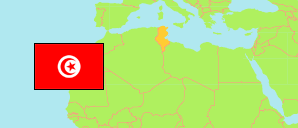
Kef
Governorate in Tunisia
Contents: Subdivision
The population development in Kef as well as related information and services (Wikipedia, Google, images).
| Name | Status | Native | Population Census 2004-04-28 | Population Census 2014-04-23 | Population Census 2024-11-06 | |
|---|---|---|---|---|---|---|
| Kef | Governorate | الكاف | 258,790 | 243,156 | 237,686 | |
| Dahmani | Delegation | الدهماني | 30,749 | 27,907 | 25,285 | → |
| El Ksour | Delegation | القصور | 17,100 | 15,215 | 14,686 | → |
| Jérissa | Delegation | الجريصة | 11,298 | 9,807 | 8,613 | → |
| Kalâat Khasba | Delegation | القلعة الخصباء | 7,353 | 6,652 | 5,663 | → |
| Kalaat Senan | Delegation | قلعة سنان | 16,454 | 15,621 | 13,517 | → |
| Kef Est | Delegation | الكاف الشرقية | 40,456 | 40,288 | 41,561 | → |
| Kef Ouest | Delegation | الكاف الغربية | 29,951 | 33,418 | 37,538 | → |
| Nebeur | Delegation | نبر | 21,229 | 19,713 | 18,651 | → |
| Sakiet Sidi Youssef | Delegation | ساقية سيدي يوسف | 20,527 | 17,500 | 16,173 | → |
| Sers | Delegation | السرس | 25,915 | 23,259 | 23,024 | → |
| Tajerouine | Delegation | تاجروين | 30,659 | 27,592 | 27,112 | → |
| Touiref [← Nebeur] | Delegation | الطويرف | 7,099 | 6,184 | 5,863 | → |
| Tunisie [Tunisia] | Republic | تونس | 9,910,872 | 10,982,754 | 11,972,169 |
Source: Institut National de la Statistique Tunisie.
Explanation: Area figures are computed using geospatial data.
Further information about the population structure:
| Gender (C 2024) | |
|---|---|
| Males | 117,859 |
| Females | 119,827 |
| Age Groups (C 2024) | |
|---|---|
| 0-14 years | 48,064 |
| 15-64 years | 152,518 |
| 65+ years | 37,104 |
| Age Distribution (C 2024) | |
|---|---|
| 80+ years | 8,405 |
| 70-79 years | 16,037 |
| 60-69 years | 28,596 |
| 50-59 years | 32,843 |
| 40-49 years | 32,931 |
| 30-39 years | 29,470 |
| 20-29 years | 24,295 |
| 10-19 years | 35,965 |
| 0-9 years | 29,144 |