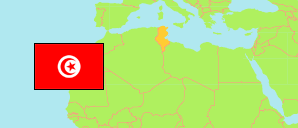
Kef Est
Delegation in Tunisia
Contents: Population
The population development of Kef Est as well as related information and services (Wikipedia, Google, images).
| Name | Status | Native | Population Census 2004-04-28 | Population Census 2014-04-23 | Population Estimate 2023-01-01 | |
|---|---|---|---|---|---|---|
| Kef Est | Delegation | الكاف الشرقية | 40,456 | 40,288 | 42,949 | |
| Tunisie [Tunisia] | Republic | تونس | 9,910,872 | 10,982,754 | 11,850,232 |
Source: Institut National de la Statistique Tunisie.
Explanation: Delegations in 2023 boundaries. Area figures are computed using geospatial data.
Further information about the population structure:
| Gender (C 2014) | |
|---|---|
| Males | 19,874 |
| Females | 20,414 |
| Age Groups (C 2014) | |
|---|---|
| 0-14 years | 8,409 |
| 15-60 years | 26,008 |
| 60+ years | 5,871 |
| Age Distribution (C 2014) | |
|---|---|
| 0-9 years | 5,668 |
| 10-19 years | 5,965 |
| 20-29 years | 6,173 |
| 30-39 years | 5,506 |
| 40-49 years | 5,904 |
| 50-59 years | 5,201 |
| 60+ years | 5,871 |
| Urbanization (C 2014) | |
|---|---|
| Rural | 11,736 |
| Urban | 28,552 |