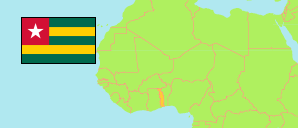
Plateaux
Region in Togo
Contents: Subdivision
The population development in Plateaux as well as related information and services (Wikipedia, Google, images).
| Name | Status | Population Census 2010-11-06 | Population Census 2022-11-08 | |
|---|---|---|---|---|
| Plateaux | Region | 1,375,165 | 1,635,946 | |
| Agou | Prefecture | 84,890 | 85,793 | → |
| Akébou | Prefecture | 62,245 | 73,830 | → |
| Amou | Prefecture | 105,091 | 114,172 | → |
| Anié | Prefecture | 124,928 | 180,158 | → |
| Danyi | Prefecture | 38,742 | 40,240 | → |
| Est-Mono | Prefecture | 121,789 | 164,460 | → |
| Haho | Prefecture | 248,160 | 305,096 | → |
| Kloto | Prefecture | 139,043 | 145,986 | → |
| Kpélé | Prefecture | 75,547 | 80,939 | → |
| Moyen-Mono | Prefecture | 77,286 | 90,505 | → |
| Ogou | Prefecture | 196,470 | 253,467 | → |
| Wawa | Prefecture | 100,974 | 101,300 | → |
| Togo | Republic | 6,191,155 | 8,095,498 |
Source: Direction Générale de la Statistique et de la Comptabilité Nationale, République Togolaise.
Explanation: Area figures are computed by using geospatial data.
Further information about the population structure:
| Gender (C 2022) | |
|---|---|
| Males | 806,154 |
| Females | 829,792 |
| Age Groups (C 2022) | |
|---|---|
| 0-14 years | 716,308 |
| 15-64 years | 856,995 |
| 65+ years | 57,838 |
| Age Distribution (C 2022) | |
|---|---|
| 80+ years | 15,522 |
| 70-79 years | 23,668 |
| 60-69 years | 53,037 |
| 50-59 years | 95,746 |
| 40-49 years | 140,167 |
| 30-39 years | 195,262 |
| 20-29 years | 227,328 |
| 10-19 years | 384,944 |
| 0-9 years | 495,467 |
| Urbanization (C 2022) | |
|---|---|
| Rural | 1,266,569 |
| Urban | 369,377 |