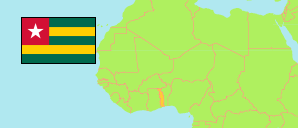
Ogou
Prefecture in Togo
Contents: Population
The population development of Ogou as well as related information and services (Wikipedia, Google, images).
| Name | Status | Population Census 2010-11-06 | Population Census 2022-11-08 | |
|---|---|---|---|---|
| Ogou | Prefecture | 196,470 | 253,467 | |
| Togo | Republic | 6,191,155 | 8,095,498 |
Source: Direction Générale de la Statistique et de la Comptabilité Nationale, République Togolaise.
Explanation: Area figures are computed by using geospatial data.
Further information about the population structure:
| Gender (C 2022) | |
|---|---|
| Males | 124,073 |
| Females | 129,394 |
| Age Groups (C 2022) | |
|---|---|
| 0-14 years | 110,363 |
| 15-64 years | 134,459 |
| 65+ years | 7,678 |
| Age Distribution (C 2022) | |
|---|---|
| 80+ years | 1,951 |
| 70-79 years | 3,192 |
| 60-69 years | 7,096 |
| 50-59 years | 13,254 |
| 40-49 years | 21,148 |
| 30-39 years | 31,346 |
| 20-29 years | 36,921 |
| 10-19 years | 61,198 |
| 0-9 years | 76,394 |
| Urbanization (C 2022) | |
|---|---|
| Rural | 155,274 |
| Urban | 98,193 |
