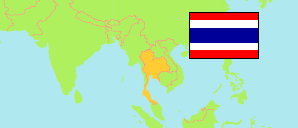
Trang
Province in Southern Region
Province
The population development of Trang.
| Name | Native | Status | Population Estimate 2005-12-31 | Population Estimate 2010-12-31 | Population Estimate 2015-12-31 | Population Estimate 2019-12-31 | |
|---|---|---|---|---|---|---|---|
| Trang | จังหวัดตรัง | Province | 602,045 | 622,659 | 640,793 | 643,116 | → |
| Southern | ภาคใต้ | Planning Region | 8,516,860 | 8,893,050 | 9,290,708 | 9,454,193 |
Contents: Municipalities
The population development of the municipalities in Trang.
| Name | Native | Status | Province | Population Estimate 2005-12-31 | Population Estimate 2010-12-31 | Population Estimate 2015-12-31 | Population Estimate 2019-12-31 | |
|---|---|---|---|---|---|---|---|---|
| Huai Yot | ห้วยยอด | Commune | Trang | 9,772 | 9,304 | 8,876 | 8,378 | → |
| Kantang | กันตัง | Town | Trang | 13,451 | 12,984 | 12,432 | 11,927 | → |
| Khlong Pang | คลองปาง | Commune | Trang | 2,033 | 2,259 | 2,311 | 2,273 | → |
| Khlong Teng | คลองเต็ง | Commune | Trang | 3,465 | 3,669 | 3,784 | 3,746 | → |
| Khuan Kun | ควนกุน | Commune | Trang | 1,906 | 2,130 | 2,123 | 2,176 | → |
| Lam Phu Ra | ลำภูรา | Commune | Trang | 3,418 | 3,512 | 3,455 | 3,662 | → |
| Na Wong | นาวง | Commune | Trang | 3,606 | 3,734 | 3,899 | 4,039 | → |
| Na Yong Nuea | นาโยงเหนือ | Commune | Trang | 3,393 | 3,583 | 3,702 | 3,533 | → |
| Sikao | สิเกา | Commune | Trang | 1,254 | 1,345 | 1,436 | 1,466 | → |
| Tha Kham | ท่าข้าม | Commune | Trang | 1,531 | 1,545 | 1,496 | 1,451 | → |
| Thung Yao | ทุ่งยาว | Commune | Trang | 1,739 | 2,466 | 2,563 | 2,536 | → |
| Trang | ตรัง | City | Trang | 59,637 | 61,019 | 60,325 | 59,304 | → |
| Wang Wiset | วังวิเศษ | Commune | Trang | 2,448 | 3,020 | 3,162 | 3,056 | → |
| Yan Ta Khao | ย่านตาขาว | Commune | Trang | 7,147 | 7,479 | 7,974 | 7,909 | → |
Source: Department of Provincial Administration, Official Statistics Registration Systems (web).
Explanation: The registered population differs strongly from the results of the 2010 census.