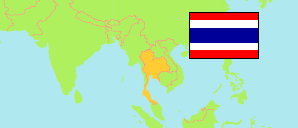
Trat
Province in Eastern Region
Province
The population development of Trat.
| Name | Native | Status | Population Estimate 2005-12-31 | Population Estimate 2010-12-31 | Population Estimate 2015-12-31 | Population Estimate 2019-12-31 | |
|---|---|---|---|---|---|---|---|
| Trat | จังหวัดตราด | Province | 219,135 | 220,921 | 229,435 | 229,914 | → |
| Eastern | ภาคตะวันออก | Planning Region | 4,333,848 | 4,615,571 | 4,903,106 | 5,056,005 |
Contents: Municipalities
The population development of the municipalities in Trat.
| Name | Native | Status | Province | Population Estimate 2005-12-31 | Population Estimate 2010-12-31 | Population Estimate 2015-12-31 | Population Estimate 2019-12-31 | |
|---|---|---|---|---|---|---|---|---|
| Bo Phloi | บ่อพลอย | Commune | Trat | 10,009 | 9,270 | 9,064 | 8,832 | → |
| Hat Lek | หาดเล็ก | Commune | Trat | 3,726 | 4,015 | 5,076 | 5,359 | → |
| Khao Saming | เขาสมิง | Commune | Trat | 1,147 | 1,766 | 1,641 | 1,477 | → |
| Khlong Yai | คลองใหญ่ | Commune | Trat | 4,976 | 5,132 | 5,482 | 5,419 | → |
| Laem Ngop | แหลมงอบ | Commune | Trat | 1,692 | 1,822 | 1,861 | 1,814 | → |
| Nam Chiao | น้ำเชี่ยว | Commune | Trat | 3,400 | 3,455 | 3,469 | 3,314 | → |
| Nong Bon | หนองบอน | Commune | Trat | ... | 7,810 | 7,767 | 7,520 | → |
| Saen Tung | แสนตุ้ง | Commune | Trat | 3,300 | 3,438 | 3,360 | 3,252 | → |
| Takang | ตะกาง | Commune | Trat | ... | 2,517 | 2,619 | 2,621 | → |
| Tha Phrik Noen Sai | ท่าพริกเนินทราย | Commune | Trat | 6,473 | 6,606 | 6,797 | 6,665 | → |
| Trat | ตราด | Town | Trat | 11,753 | 10,571 | 10,670 | 10,185 | → |
Source: Department of Provincial Administration, Official Statistics Registration Systems (web).
Explanation: The registered population differs strongly from the results of the 2010 census.