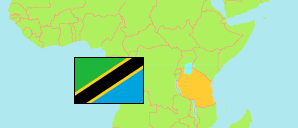
Misungwi
District in Lake Zone
Contents: Subdivision
The population in Misungwi as well as related information and services (Wikipedia, Google, images).
| Name | Status | Population Census 2022-08-23 | |
|---|---|---|---|
| Misungwi | District | 467,867 | |
| Buhingo | Rural Ward | 16,157 | → |
| Buhunda | Rural Ward | 11,130 | → |
| Bulemeji | Rural Ward | 10,943 | → |
| Busongo | Rural Ward | 10,591 | → |
| Fella | Rural Ward | 11,346 | → |
| Gulumungu | Rural Ward | 13,108 | → |
| Idetemya | Rural Ward | 25,095 | → |
| Igokelo | Rural Ward | 22,192 | → |
| Ilujamate | Rural Ward | 14,810 | → |
| Isenengeja | Rural Ward | 10,077 | → |
| Kanyelele | Rural Ward | 17,415 | → |
| Kasololo | Rural Ward | 20,051 | → |
| Kijima | Rural Ward | 14,374 | → |
| Koromije | Rural Ward | 15,446 | → |
| Lubili | Rural Ward | 14,810 | → |
| Mabuki | Rural Ward | 21,008 | → |
| Mamaye | Rural Ward | 10,311 | → |
| Mbarika | Rural Ward | 18,179 | → |
| Misasi (Masasi) | Mixed Ward | 18,511 | → |
| Misungwi | Mixed Ward | 45,959 | → |
| Mondo | Rural Ward | 10,641 | → |
| Mwaniko | Rural Ward | 10,729 | → |
| Nhundulu | Rural Ward | 14,074 | → |
| Shilalo | Rural Ward | 17,606 | → |
| Sumbugu | Rural Ward | 17,181 | → |
| Ukiriguru | Rural Ward | 11,903 | → |
| Usagara | Mixed Ward | 44,220 | → |
| Lake | Zone | 18,891,557 |
Source: National Bureau of Statistics Tanzania.
Explanation: Area figures are derived from geospatial data.
