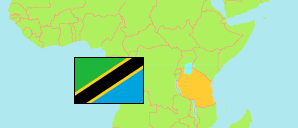
Mwanza
Region in Tanzania
Contents: Subdivision
The population development in Mwanza as well as related information and services (Wikipedia, Google, images).
| Name | Status | Population Census 1988-08-27 | Population Census 2002-08-01 | Population Census 2012-08-26 | Population Census 2022-08-23 | |
|---|---|---|---|---|---|---|
| Mwanza | Region | ... | 2,058,866 | 2,772,509 | 3,699,872 | |
| Buchosa (← Sengerema) | District | ... | ... | 327,767 | 413,110 | → |
| Ilemela Municipal | Municipality | ... | 256,884 | 343,001 | 509,687 | → |
| Kwimba | District | 236,443 | 314,925 | 406,509 | 480,025 | → |
| Magu | District | ... | ... | 299,759 | 421,119 | → |
| Misungwi | District | 191,283 | 256,133 | 351,607 | 467,867 | → |
| Mwanza (Nyamagana Municipal) | City | 109,985 | 209,806 | 363,452 | 594,834 | → |
| Sengerema | District | ... | ... | 335,267 | 425,415 | → |
| Ukerewe | District | 172,946 | 260,831 | 345,147 | 387,815 | → |
| Tanzania | United Republic | 23,174,336 | 34,443,603 | 44,928,923 | 61,741,120 |
Source: National Bureau of Statistics Tanzania.
Explanation: Area figures of districts are calculated from geospatial data.
Further information about the population structure:
| Gender (C 2022) | |
|---|---|
| Males | 1,802,183 |
| Females | 1,897,689 |
| Urbanization (C 2022) | |
|---|---|
| Rural | 2,236,138 |
| Urban | 1,463,734 |
| Age Groups (C 2022) | |
|---|---|
| 0-14 years | 1,663,925 |
| 15-64 years | 1,923,763 |
| 65+ years | 112,184 |
| Age Distribution (C 2022) | |
|---|---|
| 80+ years | 29,720 |
| 70-79 years | 48,748 |
| 60-69 years | 95,710 |
| 50-59 years | 163,181 |
| 40-49 years | 273,930 |
| 30-39 years | 401,853 |
| 20-29 years | 618,346 |
| 10-19 years | 916,924 |
| 0-9 years | 1,151,460 |
