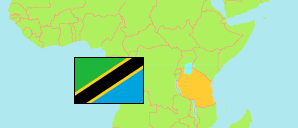
Magu
District in Lake Zone
Contents: Subdivision
The population in Magu as well as related information and services (Wikipedia, Google, images).
| Name | Status | Population Census 2022-08-23 | |
|---|---|---|---|
| Magu | District | 421,119 | |
| Buhumbi | Rural Ward | 12,815 | → |
| Bujashi | Rural Ward | 20,449 | → |
| Bujora | Mixed Ward | 31,787 | → |
| Bukandwe | Rural Ward | 22,180 | → |
| Chabula | Rural Ward | 9,910 | → |
| Isandula | Mixed Ward | 11,383 | → |
| Itumbili | Mixed Ward | 6,272 | → |
| Jinjimili | Rural Ward | 11,576 | → |
| Kabila | Rural Ward | 17,318 | → |
| Kahangara | Rural Ward | 23,145 | → |
| Kandawe | Mixed Ward | 21,605 | → |
| Kisesa | Mixed Ward | 33,548 | → |
| Kitongo Sima | Rural Ward | 17,377 | → |
| Kongolo | Rural Ward | 6,597 | → |
| Lubugu | Rural Ward | 18,726 | → |
| Lutale | Rural Ward | 16,511 | → |
| Magu Mjini | Mixed Ward | 9,941 | → |
| Mwamabanza | Rural Ward | 7,678 | → |
| Mwamanga | Rural Ward | 15,450 | → |
| Ng'haya | Rural Ward | 25,492 | → |
| Nkungulu | Rural Ward | 10,982 | → |
| Nyanguge | Mixed Ward | 22,865 | → |
| Nyigogo | Rural Ward | 18,860 | → |
| Shishani | Mixed Ward | 20,178 | → |
| Sukuma | Rural Ward | 8,474 | → |
| Lake | Zone | 18,891,557 |
Source: National Bureau of Statistics Tanzania.
Explanation: Area figures are derived from geospatial data.