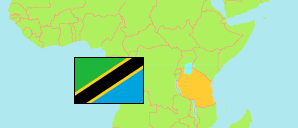
Shinyanga
Region in Tanzania
Contents: Subdivision
The population development in Shinyanga as well as related information and services (Wikipedia, Google, images).
| Name | Status | Population Census 1988-08-27 | Population Census 2002-08-01 | Population Census 2012-08-26 | Population Census 2022-08-23 | |
|---|---|---|---|---|---|---|
| Shinyanga | Region | ... | 1,249,226 | 1,534,808 | 2,241,299 | |
| Kahama Municipality | Municipality | ... | ... | 242,208 | 453,654 | → |
| Kishapu | District | 192,549 | 239,305 | 272,990 | 335,483 | → |
| Msalala (← Kahama Rural) | District | ... | ... | 250,727 | 378,214 | → |
| Shinyanga Municipal | Municipality | 98,682 | 134,523 | 161,391 | 214,744 | → |
| Shinyanga Rural | District | 212,847 | 276,393 | 334,417 | 468,611 | → |
| Ushetu (← Kahama Rural) | District | ... | ... | 273,075 | 390,593 | → |
| Tanzania | United Republic | 23,174,336 | 34,443,603 | 44,928,923 | 61,741,120 |
Source: National Bureau of Statistics Tanzania.
Explanation: Area figures of districts are calculated from geospatial data.
Further information about the population structure:
| Gender (C 2022) | |
|---|---|
| Males | 1,102,879 |
| Females | 1,138,420 |
| Urbanization (C 2022) | |
|---|---|
| Rural | 1,525,411 |
| Urban | 715,888 |
| Age Groups (C 2022) | |
|---|---|
| 0-14 years | 1,035,430 |
| 15-64 years | 1,139,035 |
| 65+ years | 66,834 |
| Age Distribution (C 2022) | |
|---|---|
| 80+ years | 18,533 |
| 70-79 years | 28,825 |
| 60-69 years | 53,268 |
| 50-59 years | 92,918 |
| 40-49 years | 150,602 |
| 30-39 years | 242,641 |
| 20-29 years | 380,743 |
| 10-19 years | 549,767 |
| 0-9 years | 724,002 |