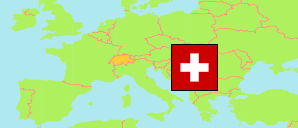
Jura
Canton in Switzerland
Contents: Subdivision
The population development in Jura as well as related information and services (Wikipedia, Google, images).
| Name | Status | Population Census 1980-12-02 | Population Census 1990-12-04 | Population Census 2000-12-05 | Population Estimate 2010-12-31 | Population Estimate 2020-12-31 | Population Estimate 2023-12-31 | |
|---|---|---|---|---|---|---|---|---|
| Jura | Canton | 64,986 | 66,233 | 68,224 | 70,032 | 73,709 | 74,540 | |
| District de Delémont | District | 31,775 | 33,185 | 34,484 | 35,921 | 38,954 | 39,654 | → |
| District de Porrentruy | District | 24,649 | 24,138 | 24,201 | 24,145 | 24,276 | 24,355 | → |
| District des Franches-Montagnes | District | 8,562 | 8,910 | 9,539 | 9,966 | 10,479 | 10,531 | → |
| Schweiz (Suisse, Svizzera, Svizra, Helvetia) [Switzerland] | Confederation | 6,365,960 | 6,873,687 | 7,288,010 | 7,870,134 | 8,670,300 | 8,960,817 |
Source: Swiss Federal Statistical Office.
Explanation: The population figures for 2023 are preliminary.
Further information about the population structure:
| Gender (E 2022) | |
|---|---|
| Males | 36,566 |
| Females | 37,299 |
| Age Groups (E 2022) | |
|---|---|
| 0-17 years | 13,485 |
| 18-64 years | 44,057 |
| 65+ years | 16,323 |
| Age Distribution (E 2022) | |
|---|---|
| 90+ years | 903 |
| 80-89 years | 3,627 |
| 70-79 years | 7,389 |
| 60-69 years | 9,520 |
| 50-59 years | 10,673 |
| 40-49 years | 8,947 |
| 30-39 years | 8,965 |
| 20-29 years | 8,760 |
| 10-19 years | 7,867 |
| 0-9 years | 7,214 |
| Citizenship (E 2022) | |
|---|---|
| Switzerland | 62,622 |
| Germany | 210 |
| France | 2,123 |
| Italy | 1,623 |
| Portugal | 1,679 |
| EU (others) | 1,688 |
| Europe (non-EU countries) | 1,323 |
| Africa | 1,253 |
| Asia | 1,021 |
| Other country | 321 |
| Country of Birth (E 2022) | |
|---|---|
| Switzerland | 59,609 |
| Other country | 14,256 |