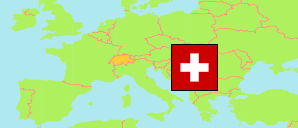
Valais
Canton in Switzerland
Contents: Subdivision
The population development in Valais as well as related information and services (Wikipedia, Google, images).
| Name | Status | Population Census 1980-12-02 | Population Census 1990-12-04 | Population Census 2000-12-05 | Population Estimate 2010-12-31 | Population Estimate 2020-12-31 | Population Estimate 2023-12-31 | |
|---|---|---|---|---|---|---|---|---|
| Valais (Wallis) | Canton | 218,707 | 249,817 | 272,399 | 312,684 | 348,503 | 365,765 | |
| Bezirk Brig | District | 19,624 | 21,537 | 23,052 | 25,033 | 27,360 | 28,710 | → |
| Bezirk Goms | District | 4,294 | 4,523 | 4,743 | 4,745 | 4,377 | 4,426 | → |
| Bezirk Leuk | District | 10,115 | 11,094 | 11,631 | 12,294 | 12,434 | 13,318 | → |
| Bezirk Raron | District | 9,216 | 9,656 | 10,380 | 10,829 | 11,095 | 11,444 | → |
| Bezirk Visp | District | 22,024 | 23,523 | 26,819 | 27,934 | 28,547 | 29,662 | → |
| District de Conthey | District | 15,201 | 18,485 | 20,094 | 24,211 | 29,424 | 30,865 | → |
| District de Martigny | District | 25,809 | 30,674 | 33,693 | 41,361 | 48,906 | 52,395 | → |
| District de Monthey | District | 23,493 | 29,708 | 33,389 | 40,766 | 47,912 | 50,397 | → |
| District d'Entremont | District | 9,561 | 10,425 | 12,138 | 14,223 | 15,519 | 16,167 | → |
| District de Saint-Maurice | District | 8,828 | 10,018 | 10,420 | 12,360 | 14,102 | 14,706 | → |
| District de Sierre | District | 32,101 | 37,683 | 40,018 | 46,134 | 49,427 | 51,440 | → |
| District de Sion | District | 30,466 | 34,213 | 37,263 | 42,759 | 48,447 | 50,781 | → |
| District d'Hérens | District | 7,975 | 8,278 | 8,759 | 10,035 | 10,953 | 11,454 | → |
| Schweiz (Suisse, Svizzera, Svizra, Helvetia) [Switzerland] | Confederation | 6,365,960 | 6,873,687 | 7,288,010 | 7,870,134 | 8,670,300 | 8,960,817 |
Source: Swiss Federal Statistical Office.
Explanation: The population figures for 2023 are preliminary.
Further information about the population structure:
| Gender (E 2022) | |
|---|---|
| Males | 177,835 |
| Females | 179,447 |
| Age Groups (E 2022) | |
|---|---|
| 0-17 years | 61,958 |
| 18-64 years | 222,045 |
| 65+ years | 73,279 |
| Age Distribution (E 2022) | |
|---|---|
| 90+ years | 3,318 |
| 80-89 years | 16,153 |
| 70-79 years | 33,980 |
| 60-69 years | 44,078 |
| 50-59 years | 52,970 |
| 40-49 years | 46,492 |
| 30-39 years | 49,202 |
| 20-29 years | 42,148 |
| 10-19 years | 35,024 |
| 0-9 years | 33,917 |
| Citizenship (E 2022) | |
|---|---|
| Switzerland | 272,671 |
| Germany | 3,823 |
| France | 12,435 |
| Italy | 10,364 |
| Portugal | 27,320 |
| EU (others) | 11,611 |
| Europe (non-EU countries) | 8,958 |
| Africa | 3,447 |
| Asia | 4,921 |
| Other country | 1,689 |
| Country of Birth (E 2022) | |
|---|---|
| Switzerland | 258,894 |
| Other country | 98,388 |