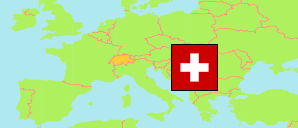
Vaud
Canton in Switzerland
Contents: Subdivision
The population development in Vaud as well as related information and services (Wikipedia, Google, images).
| Name | Status | Population Census 1980-12-02 | Population Census 1990-12-04 | Population Census 2000-12-05 | Population Estimate 2010-12-31 | Population Estimate 2020-12-31 | Population Estimate 2023-12-31 | |
|---|---|---|---|---|---|---|---|---|
| Vaud (Waadt) | Canton | 528,747 | 601,816 | 640,657 | 713,281 | 814,762 | 845,759 | |
| District d'Aigle | District | 27,320 | 32,516 | 35,248 | 40,143 | 46,253 | 49,217 | → |
| District de la Broye-Vully | District | 26,518 | 29,843 | 30,862 | 35,337 | 44,552 | 47,066 | → |
| District de la Riviera-Pays-d'Enhaut | District | 63,762 | 70,819 | 72,023 | 79,431 | 85,976 | 88,768 | → |
| District de Lausanne | District | 141,109 | 145,961 | 144,764 | 150,362 | 168,127 | 173,635 | → |
| District de Lavaux-Oron | District | 40,866 | 47,389 | 51,347 | 56,824 | 63,446 | 65,113 | → |
| District de l'Ouest lausannois | District | 53,522 | 61,069 | 63,242 | 68,232 | 79,015 | 82,525 | → |
| District de Morges | District | 48,142 | 58,290 | 64,499 | 73,747 | 84,533 | 88,363 | → |
| District de Nyon | District | 46,340 | 61,204 | 74,083 | 89,601 | 103,305 | 107,078 | → |
| District du Gros-de-Vaud | District | 20,938 | 26,948 | 31,401 | 37,917 | 46,421 | 48,083 | → |
| District du Jura-Nord vaudois | District | 60,230 | 67,777 | 73,188 | 81,687 | 93,134 | 95,911 | → |
| Schweiz (Suisse, Svizzera, Svizra, Helvetia) [Switzerland] | Confederation | 6,365,960 | 6,873,687 | 7,288,010 | 7,870,134 | 8,670,300 | 8,960,817 |
Source: Swiss Federal Statistical Office.
Explanation: The population figures for 2023 are preliminary.
Further information about the population structure:
| Gender (E 2022) | |
|---|---|
| Males | 408,209 |
| Females | 422,222 |
| Age Groups (E 2022) | |
|---|---|
| 0-17 years | 161,170 |
| 18-64 years | 530,422 |
| 65+ years | 138,839 |
| Age Distribution (E 2022) | |
|---|---|
| 90+ years | 8,275 |
| 80-89 years | 32,506 |
| 70-79 years | 62,239 |
| 60-69 years | 82,478 |
| 50-59 years | 116,801 |
| 40-49 years | 119,061 |
| 30-39 years | 121,880 |
| 20-29 years | 106,363 |
| 10-19 years | 93,099 |
| 0-9 years | 87,729 |
| Citizenship (E 2022) | |
|---|---|
| Switzerland | 554,772 |
| Germany | 5,753 |
| France | 56,671 |
| Italy | 30,020 |
| Portugal | 53,361 |
| EU (others) | 40,724 |
| Europe (non-EU countries) | 36,377 |
| Africa | 18,142 |
| Asia | 19,198 |
| Other country | 15,247 |
| Country of Birth (E 2022) | |
|---|---|
| Switzerland | 496,186 |
| Other country | 334,245 |