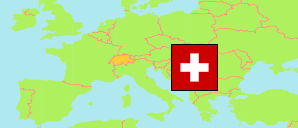
Ticino
Canton in Switzerland
Contents: Subdivision
The population development in Ticino as well as related information and services (Wikipedia, Google, images).
| Name | Status | Population Census 1980-12-02 | Population Census 1990-12-04 | Population Census 2000-12-05 | Population Estimate 2010-12-31 | Population Estimate 2020-12-31 | Population Estimate 2024-12-31 | |
|---|---|---|---|---|---|---|---|---|
| Ticino | Canton | 265,899 | 282,181 | 306,846 | 333,753 | 350,986 | 358,877 | |
| Distretto di Bellinzona | District | 38,907 | 41,871 | 45,227 | 50,819 | 55,906 | 58,348 | → |
| Distretto di Blenio | District | 5,040 | 5,080 | 5,287 | 5,530 | 5,656 | 5,613 | → |
| Distretto di Leventina | District | 11,699 | 10,032 | 9,502 | 9,600 | 8,827 | 8,752 | → |
| Distretto di Locarno | District | 50,778 | 52,286 | 57,327 | 61,707 | 63,774 | 64,330 | → |
| Distretto di Lugano | District | 104,895 | 115,413 | 128,911 | 141,661 | 150,556 | 154,926 | → |
| Distretto di Mendrisio | District | 41,638 | 43,761 | 45,724 | 48,729 | 49,969 | 50,446 | → |
| Distretto di Riviera | District | 8,292 | 8,717 | 9,275 | 9,945 | 10,346 | 10,470 | → |
| Distretto di Vallemaggia | District | 4,650 | 5,021 | 5,593 | 5,762 | 5,952 | 5,992 | → |
| Schweiz (Suisse, Svizzera, Svizra, Helvetia) [Switzerland] | Confederation | 6,365,960 | 6,873,687 | 7,288,010 | 7,870,134 | 8,670,300 | 9,048,905 |
Source: Swiss Federal Statistical Office.
Explanation: The population figures for 2024 are preliminary.
Further information about the population structure:
| Gender (E 2023) | |
|---|---|
| Males | 174,159 |
| Females | 183,561 |
| Age Groups (E 2023) | |
|---|---|
| 0-17 years | 55,687 |
| 18-64 years | 217,368 |
| 65+ years | 84,665 |
| Age Distribution (E 2023) | |
|---|---|
| 90+ years | 5,217 |
| 80-89 years | 22,481 |
| 70-79 years | 36,328 |
| 60-69 years | 46,201 |
| 50-59 years | 58,647 |
| 40-49 years | 47,165 |
| 30-39 years | 40,783 |
| 20-29 years | 38,021 |
| 10-19 years | 34,697 |
| 0-9 years | 28,180 |
| Citizenship (E 2023) | |
|---|---|
| Switzerland | 253,794 |
| Germany | 2,979 |
| France | 984 |
| Italy | 63,106 |
| Portugal | 6,752 |
| EU (others) | 9,374 |
| Europe (non-EU countries) | 11,300 |
| Africa | 2,273 |
| Asia | 3,622 |
| Other Citizenship | 3,502 |
| Country of Birth (E 2023) | |
|---|---|
| Switzerland | 223,568 |
| Other country | 134,152 |
