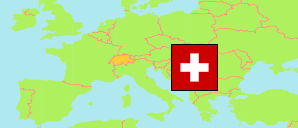
Thurgau
Canton in Switzerland
Contents: Subdivision
The population development in Thurgau as well as related information and services (Wikipedia, Google, images).
| Name | Status | Population Census 1980-12-02 | Population Census 1990-12-04 | Population Census 2000-12-05 | Population Estimate 2010-12-31 | Population Estimate 2020-12-31 | Population Estimate 2024-12-31 | |
|---|---|---|---|---|---|---|---|---|
| Thurgau [Thurgovia] | Canton | 183,795 | 209,362 | 228,875 | 248,444 | 282,909 | 299,442 | |
| Bezirk Arbon | District | 40,260 | 44,559 | 48,121 | 51,893 | 58,414 | 62,328 | → |
| Bezirk Frauenfeld | District | 45,435 | 52,102 | 57,406 | 61,778 | 69,773 | 73,313 | → |
| Bezirk Kreuzlingen | District | 31,087 | 34,489 | 37,465 | 42,559 | 49,760 | 52,736 | → |
| Bezirk Münchwilen | District | 28,773 | 34,380 | 38,302 | 42,024 | 48,285 | 50,883 | → |
| Bezirk Weinfelden | District | 38,240 | 43,832 | 47,581 | 50,190 | 56,677 | 60,182 | → |
| Schweiz (Suisse, Svizzera, Svizra, Helvetia) [Switzerland] | Confederation | 6,365,960 | 6,873,687 | 7,288,010 | 7,870,134 | 8,670,300 | 9,048,905 |
Source: Swiss Federal Statistical Office.
Explanation: The population figures for 2024 are preliminary.
Further information about the population structure:
| Gender (E 2023) | |
|---|---|
| Males | 148,878 |
| Females | 146,342 |
| Age Groups (E 2023) | |
|---|---|
| 0-17 years | 54,605 |
| 18-64 years | 183,854 |
| 65+ years | 56,761 |
| Age Distribution (E 2023) | |
|---|---|
| 90+ years | 2,478 |
| 80-89 years | 12,356 |
| 70-79 years | 24,945 |
| 60-69 years | 38,023 |
| 50-59 years | 43,321 |
| 40-49 years | 39,293 |
| 30-39 years | 42,353 |
| 20-29 years | 32,216 |
| 10-19 years | 29,271 |
| 0-9 years | 30,964 |
| Citizenship (E 2023) | |
|---|---|
| Switzerland | 215,329 |
| Germany | 25,864 |
| France | 321 |
| Italy | 10,113 |
| Portugal | 4,581 |
| EU (others) | 15,869 |
| Europe (non-EU countries) | 17,388 |
| Africa | 1,293 |
| Asia | 3,348 |
| Other Citizenship | 1,100 |
| Country of Birth (E 2023) | |
|---|---|
| Switzerland | 209,398 |
| Other country | 85,822 |
