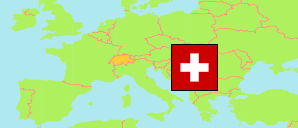
Aargau
Canton in Switzerland
Contents: Subdivision
The population development in Aargau as well as related information and services (Wikipedia, Google, images).
| Name | Status | Population Census 1980-12-02 | Population Census 1990-12-04 | Population Census 2000-12-05 | Population Estimate 2010-12-31 | Population Estimate 2020-12-31 | Population Estimate 2024-12-31 | |
|---|---|---|---|---|---|---|---|---|
| Aargau | Canton | 453,442 | 507,508 | 547,493 | 611,466 | 694,072 | 735,619 | |
| Bezirk Aarau | District | 57,805 | 62,384 | 63,191 | 70,594 | 80,309 | 84,903 | → |
| Bezirk Baden | District | 98,769 | 109,557 | 116,537 | 131,565 | 146,064 | 154,042 | → |
| Bezirk Bremgarten | District | 46,430 | 56,141 | 61,661 | 69,329 | 79,366 | 83,935 | → |
| Bezirk Brugg | District | 36,364 | 40,130 | 42,344 | 45,129 | 50,308 | 53,121 | → |
| Bezirk Kulm | District | 30,761 | 33,332 | 35,904 | 37,887 | 42,878 | 46,747 | → |
| Bezirk Laufenburg | District | 20,382 | 23,804 | 27,540 | 30,825 | 35,013 | 37,032 | → |
| Bezirk Lenzburg | District | 37,684 | 42,111 | 46,398 | 53,169 | 65,707 | 70,063 | → |
| Bezirk Muri | District | 19,810 | 23,853 | 28,254 | 32,339 | 37,379 | 39,633 | → |
| Bezirk Rheinfelden | District | 29,374 | 32,562 | 37,257 | 43,805 | 48,164 | 49,688 | → |
| Bezirk Zofingen | District | 50,936 | 55,452 | 58,244 | 64,710 | 73,843 | 78,486 | → |
| Bezirk Zurzach | District | 25,127 | 28,182 | 30,163 | 32,114 | 35,041 | 37,969 | → |
| Schweiz (Suisse, Svizzera, Svizra, Helvetia) [Switzerland] | Confederation | 6,365,960 | 6,873,687 | 7,288,010 | 7,870,134 | 8,670,300 | 9,048,905 |
Source: Swiss Federal Statistical Office.
Explanation: The population figures for 2024 are preliminary.
Further information about the population structure:
| Gender (E 2023) | |
|---|---|
| Males | 365,960 |
| Females | 360,934 |
| Age Groups (E 2023) | |
|---|---|
| 0-17 years | 134,140 |
| 18-64 years | 455,743 |
| 65+ years | 137,011 |
| Age Distribution (E 2023) | |
|---|---|
| 90+ years | 5,955 |
| 80-89 years | 30,491 |
| 70-79 years | 60,745 |
| 60-69 years | 88,812 |
| 50-59 years | 106,213 |
| 40-49 years | 101,758 |
| 30-39 years | 104,364 |
| 20-29 years | 80,090 |
| 10-19 years | 73,398 |
| 0-9 years | 75,068 |
| Citizenship (E 2023) | |
|---|---|
| Switzerland | 528,295 |
| Germany | 37,775 |
| France | 1,557 |
| Italy | 29,741 |
| Portugal | 9,778 |
| EU (others) | 37,900 |
| Europe (non-EU countries) | 56,903 |
| Africa | 6,696 |
| Asia | 14,001 |
| Other Citizenship | 4,139 |
| Country of Birth (E 2023) | |
|---|---|
| Switzerland | 510,856 |
| Other country | 216,038 |
