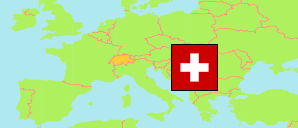
St. Gallen
Canton in Switzerland
Contents: Subdivision
The population development in St. Gallen as well as related information and services (Wikipedia, Google, images).
| Name | Status | Population Census 1980-12-02 | Population Census 1990-12-04 | Population Census 2000-12-05 | Population Estimate 2010-12-31 | Population Estimate 2020-12-31 | Population Estimate 2024-12-31 | |
|---|---|---|---|---|---|---|---|---|
| St. Gallen | Canton | 391,995 | 427,501 | 452,837 | 478,907 | 514,504 | 539,944 | |
| Wahlkreis Rheintal | District | 50,927 | 55,676 | 61,644 | 67,509 | 74,372 | 78,858 | → |
| Wahlkreis Rorschach | District | 34,463 | 37,263 | 38,382 | 41,047 | 43,928 | 45,822 | → |
| Wahlkreis Sarganserland | District | 29,646 | 32,630 | 35,339 | 37,775 | 41,490 | 44,243 | → |
| Wahlkreis See-Gaster | District | 44,842 | 52,581 | 57,906 | 62,499 | 68,425 | 72,084 | → |
| Wahlkreis St. Gallen | District | 110,167 | 113,928 | 114,305 | 117,823 | 122,903 | 127,169 | → |
| Wahlkreis Toggenburg | District | 40,784 | 44,019 | 45,907 | 45,056 | 46,954 | 49,290 | → |
| Wahlkreis Werdenberg | District | 25,808 | 29,503 | 33,004 | 35,644 | 39,993 | 42,586 | → |
| Wahlkreis Wil | District | 55,358 | 61,901 | 66,350 | 71,554 | 76,439 | 79,892 | → |
| Schweiz (Suisse, Svizzera, Svizra, Helvetia) [Switzerland] | Confederation | 6,365,960 | 6,873,687 | 7,288,010 | 7,870,134 | 8,670,300 | 9,048,905 |
Source: Swiss Federal Statistical Office.
Explanation: The population figures for 2024 are preliminary.
Further information about the population structure:
| Gender (E 2023) | |
|---|---|
| Males | 269,080 |
| Females | 266,034 |
| Age Groups (E 2023) | |
|---|---|
| 0-17 years | 98,586 |
| 18-64 years | 333,548 |
| 65+ years | 102,980 |
| Age Distribution (E 2023) | |
|---|---|
| 90+ years | 4,749 |
| 80-89 years | 24,097 |
| 70-79 years | 45,092 |
| 60-69 years | 64,581 |
| 50-59 years | 74,736 |
| 40-49 years | 70,240 |
| 30-39 years | 77,150 |
| 20-29 years | 65,081 |
| 10-19 years | 54,265 |
| 0-9 years | 55,123 |
| Citizenship (E 2023) | |
|---|---|
| Switzerland | 393,155 |
| Germany | 26,258 |
| France | 699 |
| Italy | 15,495 |
| Portugal | 5,894 |
| EU (others) | 33,320 |
| Europe (non-EU countries) | 42,576 |
| Africa | 5,468 |
| Asia | 9,719 |
| Other Citizenship | 2,400 |
| Country of Birth (E 2023) | |
|---|---|
| Switzerland | 382,217 |
| Other country | 152,897 |
