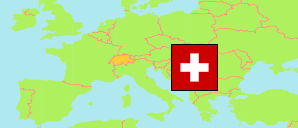
Solothurn
Canton in Switzerland
Contents: Subdivision
The population development in Solothurn as well as related information and services (Wikipedia, Google, images).
| Name | Status | Population Census 1980-12-02 | Population Census 1990-12-04 | Population Census 2000-12-05 | Population Estimate 2010-12-31 | Population Estimate 2020-12-31 | Population Estimate 2024-12-31 | |
|---|---|---|---|---|---|---|---|---|
| Solothurn | Canton | 218,102 | 231,746 | 244,341 | 255,284 | 277,462 | 289,792 | |
| Bezirk Bucheggberg | District | 5,766 | 6,250 | 7,092 | 7,543 | 8,009 | 8,254 | → |
| Bezirk Dorneck | District | 13,309 | 15,701 | 17,978 | 19,517 | 20,802 | 21,325 | → |
| Bezirk Gäu | District | 12,740 | 14,429 | 16,737 | 18,135 | 22,005 | 23,379 | → |
| Bezirk Gösgen | District | 20,359 | 21,050 | 22,211 | 23,155 | 24,793 | 26,081 | → |
| Bezirk Lebern | District | 39,580 | 40,833 | 42,008 | 43,228 | 46,439 | 48,305 | → |
| Bezirk Olten | District | 46,161 | 48,154 | 48,986 | 51,240 | 56,109 | 58,726 | → |
| Bezirk Solothurn | District | 15,778 | 15,748 | 15,489 | 16,066 | 16,802 | 16,847 | → |
| Bezirk Thal | District | 12,773 | 13,587 | 14,038 | 14,216 | 14,752 | 15,519 | → |
| Bezirk Thierstein | District | 11,266 | 12,210 | 13,483 | 13,947 | 14,802 | 15,436 | → |
| Bezirk Wasseramt | District | 40,370 | 43,784 | 46,319 | 48,237 | 52,949 | 55,920 | → |
| Schweiz (Suisse, Svizzera, Svizra, Helvetia) [Switzerland] | Confederation | 6,365,960 | 6,873,687 | 7,288,010 | 7,870,134 | 8,670,300 | 9,051,029 |
Source: Swiss Federal Statistical Office.
Explanation: The population figures for 2024 are final.
Further information about the population structure:
| Gender (E 2024) | |
|---|---|
| Males | 145,155 |
| Females | 144,637 |
| Age Groups (E 2024) | |
|---|---|
| 0-17 years | 50,554 |
| 18-64 years | 177,672 |
| 65+ years | 61,566 |
| Age Distribution (E 2024) | |
|---|---|
| 90+ years | 3,081 |
| 80-89 years | 14,020 |
| 70-79 years | 26,701 |
| 60-69 years | 39,234 |
| 50-59 years | 41,167 |
| 40-49 years | 38,539 |
| 30-39 years | 39,937 |
| 20-29 years | 31,118 |
| 10-19 years | 27,953 |
| 0-9 years | 28,042 |
| Citizenship (E 2024) | |
|---|---|
| Switzerland | 215,619 |
| Germany | 10,514 |
| France | 721 |
| Italy | 10,909 |
| Portugal | 2,142 |
| EU (others) | 14,141 |
| Europe (non-EU countries) | 22,848 |
| Africa | 4,174 |
| Asia | 7,222 |
| Other Citizenship | 1,383 |
| Country of Birth (E 2024) | |
|---|---|
| Switzerland | 214,050 |
| Other country | 75,742 |