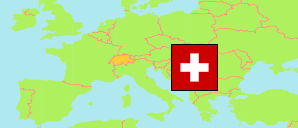
Bern
Canton in Switzerland
Contents: Subdivision
The population development in Bern as well as related information and services (Wikipedia, Google, images).
| Name | Status | Population Census 1980-12-02 | Population Census 1990-12-04 | Population Census 2000-12-05 | Population Estimate 2010-12-31 | Population Estimate 2020-12-31 | Population Estimate 2023-12-31 | |
|---|---|---|---|---|---|---|---|---|
| Bern (Berne) | Canton | 898,343 | 943,070 | 957,144 | 979,754 | 1,043,081 | 1,063,215 | |
| Arrondissement administratif Jura bernois [Bernese Jura] | District | 51,593 | 51,058 | 51,408 | 51,668 | 53,715 | 53,918 | → |
| Verwaltungskreis Bern-Mittelland | District | 372,515 | 386,478 | 384,935 | 388,214 | 418,140 | 425,547 | → |
| Verwaltungskreis Biel/Bienne | District | 91,738 | 91,834 | 88,584 | 93,859 | 102,425 | 105,008 | → |
| Verwaltungskreis Emmental | District | 86,012 | 90,190 | 91,806 | 93,677 | 97,666 | 99,520 | → |
| Verwaltungskreis Frutigen-Niedersimmental | District | 32,826 | 36,253 | 38,488 | 39,171 | 40,607 | 41,412 | → |
| Verwaltungskreis Interlaken-Oberhasli | District | 41,275 | 44,786 | 46,371 | 46,510 | 47,645 | 48,745 | → |
| Verwaltungskreis Oberaargau | District | 68,780 | 73,400 | 75,343 | 77,181 | 82,472 | 84,634 | → |
| Verwaltungskreis Obersimmental-Saanen | District | 14,516 | 15,689 | 16,743 | 16,810 | 16,550 | 16,785 | → |
| Verwaltungskreis Seeland | District | 53,289 | 60,365 | 65,045 | 68,572 | 76,052 | 78,225 | → |
| Verwaltungskreis Thun | District | 85,799 | 93,017 | 98,421 | 104,092 | 107,809 | 109,421 | → |
| Schweiz (Suisse, Svizzera, Svizra, Helvetia) [Switzerland] | Confederation | 6,365,960 | 6,873,687 | 7,288,010 | 7,870,134 | 8,670,300 | 8,960,817 |
Source: Swiss Federal Statistical Office.
Explanation: The population figures for 2023 are preliminary.
Further information about the population structure:
| Gender (E 2022) | |
|---|---|
| Males | 516,805 |
| Females | 534,632 |
| Age Groups (E 2022) | |
|---|---|
| 0-17 years | 181,388 |
| 18-64 years | 639,898 |
| 65+ years | 230,151 |
| Age Distribution (E 2022) | |
|---|---|
| 90+ years | 11,949 |
| 80-89 years | 53,436 |
| 70-79 years | 103,843 |
| 60-69 years | 131,865 |
| 50-59 years | 153,879 |
| 40-49 years | 138,296 |
| 30-39 years | 144,012 |
| 20-29 years | 113,648 |
| 10-19 years | 99,259 |
| 0-9 years | 101,250 |
| Citizenship (E 2022) | |
|---|---|
| Switzerland | 872,661 |
| Germany | 28,168 |
| France | 5,831 |
| Italy | 21,011 |
| Portugal | 14,270 |
| EU (others) | 32,958 |
| Europe (non-EU countries) | 32,002 |
| Africa | 15,394 |
| Asia | 22,566 |
| Other country | 6,279 |
| Country of Birth (E 2022) | |
|---|---|
| Switzerland | 833,533 |
| Other country | 217,904 |