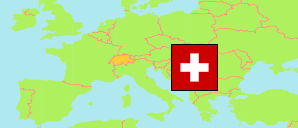
Zürich
Canton in Switzerland
Contents: Subdivision
The population development in Zürich as well as related information and services (Wikipedia, Google, images).
| Name | Status | Population Census 1980-12-02 | Population Census 1990-12-04 | Population Census 2000-12-05 | Population Estimate 2010-12-31 | Population Estimate 2020-12-31 | Population Estimate 2024-12-31 | |
|---|---|---|---|---|---|---|---|---|
| Zürich [Zurich] | Canton | 1,122,839 | 1,179,044 | 1,247,906 | 1,373,068 | 1,553,423 | 1,619,499 | |
| Bezirk Affoltern | District | 29,513 | 35,409 | 41,821 | 48,096 | 55,839 | 58,172 | → |
| Bezirk Andelfingen | District | 21,304 | 23,411 | 26,608 | 29,511 | 31,959 | 33,179 | → |
| Bezirk Bülach | District | 91,599 | 101,320 | 110,465 | 131,879 | 156,900 | 165,583 | → |
| Bezirk Dielsdorf | District | 50,209 | 59,039 | 68,758 | 80,090 | 92,079 | 96,910 | → |
| Bezirk Dietikon | District | 67,715 | 70,710 | 73,169 | 80,547 | 94,533 | 98,142 | → |
| Bezirk Hinwil | District | 62,980 | 70,609 | 77,206 | 87,822 | 97,098 | 101,988 | → |
| Bezirk Horgen | District | 101,552 | 104,005 | 106,670 | 115,301 | 127,263 | 132,489 | → |
| Bezirk Meilen | District | 79,605 | 80,719 | 87,030 | 97,034 | 106,506 | 109,516 | → |
| Bezirk Pfäffikon | District | 40,249 | 46,051 | 50,269 | 55,768 | 61,081 | 63,578 | → |
| Bezirk Uster | District | 87,506 | 95,644 | 106,071 | 120,607 | 135,234 | 141,546 | → |
| Bezirk Winterthur | District | 121,085 | 127,084 | 136,566 | 153,556 | 173,053 | 182,026 | → |
| Bezirk Zürich [Zurich] | District | 369,522 | 365,043 | 363,273 | 372,857 | 421,878 | 436,370 | → |
| Schweiz (Suisse, Svizzera, Svizra, Helvetia) [Switzerland] | Confederation | 6,365,960 | 6,873,687 | 7,288,010 | 7,870,134 | 8,670,300 | 9,048,905 |
Source: Swiss Federal Statistical Office.
Explanation: The population figures for 2024 are preliminary.
Further information about the population structure:
| Gender (E 2023) | |
|---|---|
| Males | 800,992 |
| Females | 804,516 |
| Age Groups (E 2023) | |
|---|---|
| 0-17 years | 287,869 |
| 18-64 years | 1,039,736 |
| 65+ years | 277,903 |
| Age Distribution (E 2023) | |
|---|---|
| 90+ years | 14,900 |
| 80-89 years | 69,337 |
| 70-79 years | 120,828 |
| 60-69 years | 166,635 |
| 50-59 years | 223,168 |
| 40-49 years | 241,184 |
| 30-39 years | 262,793 |
| 20-29 years | 189,036 |
| 10-19 years | 154,519 |
| 0-9 years | 163,108 |
| Citizenship (E 2023) | |
|---|---|
| Switzerland | 1,145,802 |
| Germany | 87,559 |
| France | 11,592 |
| Italy | 60,264 |
| Portugal | 27,218 |
| EU (others) | 104,698 |
| Europe (non-EU countries) | 87,268 |
| Africa | 17,773 |
| Asia | 44,142 |
| Other Citizenship | 18,908 |
| Country of Birth (E 2023) | |
|---|---|
| Switzerland | 1,019,532 |
| Other country | 585,976 |
