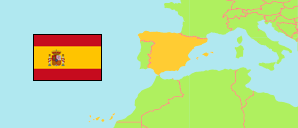
Las Torres de Cotillas
in Murcia (Murcia)
Contents: Municipality
The population development of Las Torres de Cotillas as well as related information and services (weather, Wikipedia, Google, images).
| Name | Province | Population Census 1981-03-01 | Population Census 1991-03-01 | Population Census 2001-11-01 | Population Census 2011-11-01 | Population Census 2021-01-01 | Population Evaluation 2023-01-01 | |
|---|---|---|---|---|---|---|---|---|
| Las Torres de Cotillas | Murcia | 11,349 | 14,132 | 16,450 | 21,478 | 21,907 | 22,305 | → |
Source: Instituto Nacional de Estadística, Madrid.
Explanation: The latest population figures are based on an evaluation of registers.
Further information about the population structure:
| Gender (R 2023) | |
|---|---|
| Males | 11,294 |
| Females | 11,011 |
| Age Groups (R 2023) | |
|---|---|
| 0-17 years | 4,595 |
| 18-64 years | 14,424 |
| 65+ years | 3,286 |
| Age Distribution (R 2023) | |
|---|---|
| 90+ years | 117 |
| 80-89 years | 668 |
| 70-79 years | 1,532 |
| 60-69 years | 2,259 |
| 50-59 years | 3,315 |
| 40-49 years | 4,041 |
| 30-39 years | 2,778 |
| 20-29 years | 2,405 |
| 10-19 years | 2,993 |
| 0-9 years | 2,197 |
| Citizenship (R 2023) | |
|---|---|
| Spain | 20,583 |
| EU | 186 |
| Europe (Rest) | 73 |
| Africa | 973 |
| America | 421 |
| Asia and Oceania | 69 |
| Country of Birth (R 2023) | |
|---|---|
| Spain | 19,874 |
| EU | 456 |
| Europe (Rest) | 102 |
| Africa | 955 |
| America | 859 |
| Asia and Oceania | 59 |