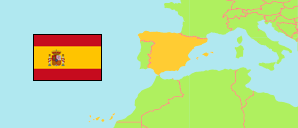
Logroño
Municipality in La Rioja Province
Municipality
The population development of Logroño.
| Name | Status | Population Estimate 2010-01-01 | Population Estimate 2015-01-01 | Population Estimate 2020-01-01 | Population Estimate 2023-01-01 | |
|---|---|---|---|---|---|---|
| Logroño | Municipality | 152,650 | 151,344 | 152,485 | 150,206 | → |
| La Rioja | Province | 322,415 | 317,053 | 319,914 | 322,282 |
Contents: Localities
The population development of the localities in Logroño.
| Name | Status | Municipality | Population Estimate 2010-01-01 | Population Estimate 2015-01-01 | Population Estimate 2020-01-01 | Population Estimate 2023-01-01 | |
|---|---|---|---|---|---|---|---|
| El Cortijo | Locality | Logroño | 231 | 243 | 228 | 236 | → |
| Logroño | Municipality seat | Logroño | 150,180 | 148,962 | 150,118 | 148,281 | → |
| Varea | Locality | Logroño | 1,872 | 1,826 | 1,860 | 1,819 | → |
Source: Instituto Nacional de Estadística, Madrid.
Explanation: Population of localities according to the municipal register (padrones municipales).