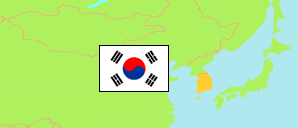
Geochang-gun
County in South Gyeongsang Province
Contents: Subdivision
The population development in Geochang-gun as well as related information and services (Wikipedia, Google, images).
| Name | Status | Native | Population Census 2005-11-01 | Population Census 2010-11-01 | Population Census 2015-11-01 | Population Census 2020-11-01 | |
|---|---|---|---|---|---|---|---|
| Geochang-gun | County | 거창군 | 60,622 | 57,323 | 60,464 | 59,595 | |
| Buksang-myeon | Rural Township | 북상면 | 1,456 | 1,349 | 1,476 | 1,425 | → |
| Gabuk-myeon | Rural Township | 가북면 | 1,470 | 1,290 | 1,346 | 1,263 | → |
| Gajo-myeon | Rural Township | 가조면 | 3,969 | 3,587 | 3,724 | 3,493 | → |
| Geochang-eup | Town | 거창읍 | 38,412 | 37,318 | 39,754 | 40,136 | → |
| Goje-myeon | Rural Township | 고제면 | 1,276 | 1,187 | 1,338 | 1,297 | → |
| Jusang-myeon | Rural Township | 주상면 | 1,660 | 1,421 | 1,493 | 1,432 | → |
| Mari-myeon | Rural Township | 마리면 | 2,251 | 2,005 | 2,042 | 1,886 | → |
| Namha-myeon | Rural Township | 남하면 | 1,594 | 1,494 | 1,444 | 1,310 | → |
| Namsang-myeon | Rural Township | 남상면 | 2,659 | 2,326 | 2,418 | 2,281 | → |
| Sinwon-myeon | Rural Township | 신원면 | 1,645 | 1,524 | 1,491 | 1,401 | → |
| Ungyang-myeon | Rural Township | 웅양면 | 1,998 | 1,834 | 1,918 | 1,791 | → |
| Wicheon-myeon | Rural Township | 위천면 | 2,232 | 1,988 | 2,020 | 1,880 | → |
| Gyeongsangnam-do [South Gyeongsang] | Province | 경상남도 | 3,056,356 | 3,160,154 | 3,334,524 | 3,333,056 |
Source: National Statistical Office of the Republic of Korea (web).
Explanation: Since 2015, a register-based census is performed. Nevertheless, the results are not consistent with the population figures from the resident registration that are higher by about 3.5% on average. Area figures are derived from geospatial data.
Further information about the population structure:
| Gender (C 2020) | |
|---|---|
| Males | 29,300 |
| Females | 30,295 |
| Age Groups (C 2020) | |
|---|---|
| 0-14 years | 6,239 |
| 15-64 years | 36,886 |
| 65+ years | 16,470 |
| Age Distribution (C 2020) | |
|---|---|
| 90+ years | 682 |
| 80-89 years | 4,617 |
| 70-79 years | 6,898 |
| 60-69 years | 9,763 |
| 50-59 years | 10,225 |
| 40-49 years | 7,426 |
| 30-39 years | 4,999 |
| 20-29 years | 5,540 |
| 10-19 years | 5,722 |
| 0-9 years | 3,723 |
| Citizenship (C 2020) | |
|---|---|
| Korea | 58,874 |
| Foreign Citizenship | 721 |