
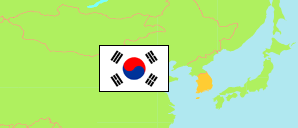
Gyeongsangnam-do
Province in South Korea
Contents: Subdivision
The population development in Gyeongsangnam-do as well as related information and services (Wikipedia, Google, images).
 icon links to further information about a selected division including its population structure (gender, age groups, age distribution, citizenship).
| Name | Status | Native | Population Census 1980-11-01 | Population Census 1990-11-01 | Population Census 2000-11-01 | Population Census 2010-11-01 | Population Census 2015-11-01 | Population Census 2020-11-01 | Population Census 2025-11-01 | |
|---|---|---|---|---|---|---|---|---|---|---|
| Gyeongsangnam-do [South Gyeongsang] | Province | 경상남도 | 2,689,376 | 2,810,194 | 2,978,502 | 3,160,154 | 3,334,524 | 3,333,056 | 3,252,634 | |
| Changnyeong-gun | County | 창녕군 | 115,836 | 84,175 | 65,369 | 55,189 | 61,635 | 61,302 | 56,576 | → |
| Changwon-si | City | 창원시 | 693,685 | 1,009,380 | 1,079,359 | 1,058,021 | 1,059,241 | 1,029,389 | 992,277 | → |
| Geochang-gun | County | 거창군 | 102,355 | 77,580 | 65,963 | 57,323 | 60,464 | 59,595 | 58,745 | → |
| Geoje-si | City | 거제시 | 109,641 | 143,184 | 168,022 | 231,271 | 261,371 | 246,965 | 240,905 | → |
| Gimhae-si | City | 김해시 | 150,787 | 185,139 | 331,979 | 494,510 | 534,124 | 552,427 | 552,713 | → |
| Goseong-gun | County | 고성군 | 92,911 | 67,657 | 55,808 | 51,703 | 53,882 | 50,016 | 46,879 | → |
| Hadong-gun | County | 하동군 | 97,618 | 65,870 | 51,583 | 41,862 | 44,918 | 41,772 | 38,036 | → |
| Haman-gun | County | 함안군 | 80,353 | 59,809 | 58,755 | 60,794 | 69,355 | 65,279 | 60,848 | → |
| Hamyang-gun | County | 함양군 | 82,782 | 55,014 | 41,943 | 38,002 | 38,454 | 37,114 | 34,477 | → |
| Hapcheon-gun | County | 합천군 | 115,685 | 72,657 | 54,344 | 43,639 | 44,797 | 42,140 | 38,129 | → |
| Jinju-si | City | 진주시 | 303,523 | 328,700 | 339,791 | 337,896 | 349,788 | 352,403 | 344,145 | → |
| Miryang-si | City | 밀양시 | 161,564 | 133,043 | 115,962 | 99,128 | 103,069 | 103,228 | 101,911 | → |
| Namhae-gun | County | 남해군 | 103,123 | 71,500 | 53,144 | 43,919 | 44,248 | 41,587 | 39,221 | → |
| Sacheon-si | City | 사천시 | 135,596 | 115,933 | 111,078 | 107,524 | 113,335 | 111,184 | 109,091 | → |
| Sancheong-gun | County | 산청군 | 72,889 | 50,179 | 38,190 | 31,898 | 34,034 | 33,500 | 32,267 | → |
| Tongyeong-si | City | 통영시 | 141,146 | 138,365 | 123,842 | 129,366 | 137,208 | 127,984 | 118,589 | → |
| Uiryeong-gun | County | 의령군 | 64,175 | 48,987 | 31,395 | 25,602 | 27,069 | 25,965 | 24,313 | → |
| Yangsan-si | City | 양산시 | 65,707 | 103,022 | 191,975 | 252,507 | 297,532 | 351,206 | 363,512 | → |
| Daehan Minguk [South Korea] | Republic | 대한민국 | 37,436,315 | 43,410,899 | 46,136,101 | 48,580,293 | 51,069,375 | 51,829,136 | 51,817,499 |
Source: National Statistical Office of the Republic of Korea.
Explanation: Since 2015, a register-based census is performed. Nevertheless, the results are not consistent with the population figures from the resident registration that are higher by about 3.5% on average.
Further information about the population structure:
| Gender (C 2025) | |
|---|---|
| Males | 1,665,199 |
| Females | 1,587,435 |
| Age Groups (C 2025) | |
|---|---|
| 0-14 years | 336,937 |
| 15-64 years | 2,186,523 |
| 65+ years | 729,174 |
| Age Distribution (C 2025) | |
|---|---|
| 90+ years | 24,713 |
| 80-89 years | 142,608 |
| 70-79 years | 302,753 |
| 60-69 years | 539,303 |
| 50-59 years | 576,716 |
| 40-49 years | 488,759 |
| 30-39 years | 383,379 |
| 20-29 years | 309,025 |
| 10-19 years | 303,983 |
| 0-9 years | 181,395 |
| Citizenship (C 2025) | |
|---|---|
| Korea | 3,117,070 |
| Foreign Citizenship | 135,564 |