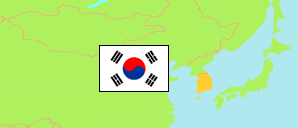
Gumi-si
City in North Gyeongsang Province
Contents: Subdivision
The population development in Gumi-si as well as related information and services (Wikipedia, Google, images).
| Name | Status | Native | Population Census 2005-11-01 | Population Census 2010-11-01 | Population Census 2015-11-01 | Population Census 2020-11-01 | |
|---|---|---|---|---|---|---|---|
| Gumi-si | City | 구미시 | 383,786 | 402,607 | 421,075 | 416,603 | |
| Bisan-dong | Quarter | 비산동 | 4,957 | 4,702 | 4,746 | 6,310 | → |
| Dogae-myeon | Rural Township | 도개면 | 2,622 | 2,282 | 2,316 | 2,138 | → |
| Doryang-dong | Quarter | 도량동 | 32,307 | 32,924 | 30,700 | 29,618 | → |
| Goa-eup | Town | 고아읍 | 30,217 | 29,853 | 31,696 | 35,526 | → |
| Gongdan 1-dong | Quarter | 공단1동 | 8,346 | 5,293 | 6,616 | 7,665 | → |
| Gongdan 2-dong | Quarter | 공단2동 | 7,697 | 3,330 | 6,626 | 5,177 | → |
| Gwangpyeong-dong | Quarter | 광평동 | 3,311 | 3,583 | 4,925 | 4,507 | → |
| Haepyeong-myeon | Rural Township | 해평면 | 5,370 | 4,872 | 4,648 | 3,879 | → |
| Hyeonggok 1-dong | Quarter | 형곡1동 | 18,058 | 16,340 | 14,829 | 14,228 | → |
| Hyeonggok 2-dong | Quarter | 형곡2동 | 23,662 | 22,234 | 20,773 | 16,680 | → |
| Imo-dong | Quarter | 임오동 | 15,492 | 17,436 | 20,803 | 18,887 | → |
| Indong-dong | Quarter | 인동동 | 52,277 | 55,284 | 57,565 | 48,178 | → |
| Jangcheon-myeon | Rural Township | 장천면 | 3,583 | 3,191 | 3,556 | 3,131 | → |
| Jinmi-dong | Quarter | 진미동 | 23,172 | 24,831 | 24,036 | 17,818 | → |
| Jisan-dong | Quarter | 지산동 | 3,777 | 3,015 | 2,845 | 2,213 | → |
| Mueul-myeon | Rural Township | 무을면 | 2,179 | 1,872 | 1,887 | 1,805 | → |
| Okseong-myeon | Rural Township | 옥성면 | 1,925 | 1,705 | 1,766 | 1,640 | → |
| Sandong-myeon | Rural Township | 산동면 | 4,269 | 4,307 | 5,177 | 26,958 | → |
| Sangmosagok-dong | Quarter | 상모사곡동 | 26,632 | 30,748 | 30,559 | 30,215 | → |
| Seonjuwonnam-dong | Quarter | 선주원남동 | 27,547 | 43,726 | 48,363 | 40,453 | → |
| Seonsan-eup | Town | 선산읍 | 15,915 | 14,368 | 14,009 | 14,613 | → |
| Sinpyeong 1-dong | Quarter | 신평1동 | 6,108 | 5,302 | 4,642 | 3,396 | → |
| Sinpyeong 2-dong | Quarter | 신평2동 | 4,116 | 3,592 | 2,627 | 3,211 | → |
| Songjeong-dong | Quarter | 송정동 | 22,240 | 19,844 | 18,381 | 23,914 | → |
| Wonpyeong 1-dong | Quarter | 원평1동 | 4,583 | 3,801 | 4,559 | 3,921 | → |
| Wonpyeong 2-dong | Quarter | 원평2동 | 4,993 | 3,912 | 3,869 | 2,948 | → |
| Yangpo-dong | Quarter | 양포동 | 28,431 | 40,260 | 48,556 | 47,574 | → |
| Gyeongsangbuk-do [North Gyeongsang] | Province | 경상북도 | 2,607,641 | 2,600,032 | 2,680,294 | 2,644,757 |
Source: National Statistical Office of the Republic of Korea (web).
Explanation: Since 2015, a register-based census is performed. Nevertheless, the results are not consistent with the population figures from the resident registration that are higher by about 3.5% on average. Area figures are derived from geospatial data.
Further information about the population structure:
| Gender (C 2020) | |
|---|---|
| Males | 214,920 |
| Females | 201,683 |
| Age Groups (C 2020) | |
|---|---|
| 0-14 years | 63,638 |
| 15-64 years | 313,242 |
| 65+ years | 39,723 |
| Age Distribution (C 2020) | |
|---|---|
| 90+ years | 1,148 |
| 80-89 years | 8,137 |
| 70-79 years | 15,975 |
| 60-69 years | 38,700 |
| 50-59 years | 68,813 |
| 40-49 years | 72,497 |
| 30-39 years | 67,127 |
| 20-29 years | 57,315 |
| 10-19 years | 45,248 |
| 0-9 years | 41,643 |
| Citizenship (C 2020) | |
|---|---|
| Korea | 410,007 |
| Foreign Citizenship | 6,596 |