
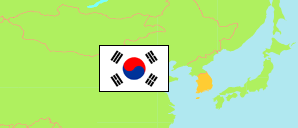
Gyeongsangbuk-do
Province in South Korea
Contents: Subdivision
The population development in Gyeongsangbuk-do as well as related information and services (Wikipedia, Google, images).
 icon links to further information about a selected division including its population structure (gender, age groups, age distribution, citizenship).
| Name | Status | Native | Population Census 1980-11-01 | Population Census 1990-11-01 | Population Census 2000-11-01 | Population Census 2010-11-01 | Population Census 2015-11-01 | Population Census 2020-11-01 | Population Census 2025-11-01 | |
|---|---|---|---|---|---|---|---|---|---|---|
| Gyeongsangbuk-do [North Gyeongsang] | Province | 경상북도 | 3,048,600 | 2,729,922 | 2,696,184 | 2,580,039 | 2,658,282 | 2,622,661 | 2,567,565 | |
| Andong-si | City | 안동시 | 237,558 | 197,228 | 182,098 | 166,197 | 168,581 | 159,412 | 154,183 | → |
| Bonghwa-gun | County | 봉화군 | 97,513 | 58,168 | 38,238 | 31,242 | 31,628 | 29,945 | 27,674 | → |
| Cheongdo-gun | County | 청도군 | 85,533 | 60,515 | 48,229 | 38,228 | 41,596 | 41,378 | 39,357 | → |
| Cheongsong-gun | County | 청송군 | 64,520 | 43,756 | 31,302 | 24,008 | 24,732 | 23,761 | 22,841 | → |
| Chilgok-gun | County | 칠곡군 | 81,972 | 78,943 | 101,549 | 114,246 | 122,462 | 115,756 | 107,701 | → |
| Gimcheon-si | City | 김천시 | 177,939 | 151,995 | 147,855 | 127,889 | 137,540 | 139,145 | 135,795 | → |
| Goryeong-gun | County | 고령군 | 48,953 | 35,280 | 35,517 | 31,817 | 34,117 | 31,419 | 30,558 | → |
| Gumi-si | City | 구미시 | 177,400 | 268,546 | 341,550 | 402,607 | 421,075 | 416,603 | 408,184 | → |
| Gyeongju-si | City | 경주시 | 289,234 | 267,491 | 275,842 | 256,150 | 262,310 | 261,778 | 260,108 | → |
| Gyeongsan-si | City | 경산시 | 134,110 | 145,074 | 228,206 | 266,036 | 278,500 | 283,733 | 299,199 | → |
| Mungyeong-si | City | 문경시 | 147,242 | 119,416 | 90,846 | 69,021 | 71,863 | 68,212 | 64,382 | → |
| Pohang-si | City | 포항시 | 396,383 | 482,836 | 515,714 | 511,390 | 511,804 | 501,109 | 490,882 | → |
| Sangju-si | City | 상주시 | 191,716 | 148,200 | 116,493 | 98,103 | 98,760 | 95,473 | 90,909 | → |
| Seongju-gun | County | 성주군 | 77,355 | 53,082 | 47,134 | 36,859 | 41,179 | 41,574 | 40,650 | → |
| Uiseong-gun | County | 의성군 | 146,063 | 96,897 | 68,353 | 51,247 | 51,021 | 49,243 | 46,462 | → |
| Uljin-gun | County | 울진군 | 90,723 | 69,990 | 60,011 | 47,108 | 49,387 | 47,151 | 45,110 | → |
| Ulleung-gun | County | 울릉군 | 18,960 | 15,283 | 10,150 | 7,764 | 8,770 | 8,444 | 8,214 | → |
| Yecheon-gun | County | 예천군 | 120,231 | 79,183 | 54,291 | 43,015 | 42,702 | 53,718 | 52,590 | → |
| Yeongcheon-si | City | 영천시 | 157,859 | 120,565 | 111,392 | 95,256 | 97,669 | 100,353 | 97,214 | → |
| Yeongdeok-gun | County | 영덕군 | 91,206 | 65,415 | 44,172 | 36,428 | 36,539 | 34,893 | 32,273 | → |
| Yeongju-si | City | 영주시 | 163,397 | 140,889 | 126,507 | 108,888 | 109,266 | 103,818 | 97,800 | → |
| Yeongyang-gun | County | 영양군 | 52,733 | 31,170 | 20,735 | 16,540 | 16,781 | 15,743 | 15,479 | → |
| Daehan Minguk [South Korea] | Republic | 대한민국 | 37,436,315 | 43,410,899 | 46,136,101 | 48,580,293 | 51,069,375 | 51,829,136 | 51,817,499 |
Source: National Statistical Office of the Republic of Korea.
Explanation: Since 2015, a register-based census is performed. Nevertheless, the results are not consistent with the population figures from the resident registration that are higher by about 3.5% on average.
Further information about the population structure:
| Gender (C 2025) | |
|---|---|
| Males | 1,312,841 |
| Females | 1,254,724 |
| Age Groups (C 2025) | |
|---|---|
| 0-14 years | 235,533 |
| 15-64 years | 1,659,916 |
| 65+ years | 672,116 |
| Age Distribution (C 2025) | |
|---|---|
| 90+ years | 26,664 |
| 80-89 years | 145,734 |
| 70-79 years | 278,076 |
| 60-69 years | 452,963 |
| 50-59 years | 431,794 |
| 40-49 years | 342,475 |
| 30-39 years | 282,199 |
| 20-29 years | 259,825 |
| 10-19 years | 217,538 |
| 0-9 years | 130,297 |
| Citizenship (C 2025) | |
|---|---|
| Korea | 2,456,636 |
| Foreign Citizenship | 110,929 |