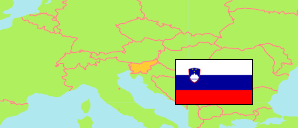
Oplotnica
Municipality in Slovenia
Contents: Population
The population development of Oplotnica as well as related information and services (Wikipedia, Google, images).
| Name | Status | Population Census 2002-03-31 | Population Census 2011-01-01 | Population Census 2021-01-01 | Population Estimate 2025-01-01 | |
|---|---|---|---|---|---|---|
| Oplotnica | Municipality | 3,866 | 3,965 | 4,154 | 4,203 | |
| Slovenija [Slovenia] | Republic | 1,964,036 | 2,050,189 | 2,108,977 | 2,130,850 |
Source: Statistical Office of the Republic of Slovenia.
Explanation: The 2011 and 2021 population figures are result of a register-based census.
Further information about the population structure:
| Gender (E 2025) | |
|---|---|
| Males | 2,167 |
| Females | 2,036 |
| Age Groups (E 2025) | |
|---|---|
| 0-17 years | 813 |
| 18-64 years | 2,545 |
| 65+ years | 845 |
| Age Distribution (E 2025) | |
|---|---|
| 90+ years | 23 |
| 80-89 years | 142 |
| 70-79 years | 408 |
| 60-69 years | 595 |
| 50-59 years | 582 |
| 40-49 years | 616 |
| 30-39 years | 582 |
| 20-29 years | 372 |
| 10-19 years | 456 |
| 0-9 years | 427 |
| Citizenship (E 2025) | |
|---|---|
| Slovenia | 4,072 |
| Foreign Citizenship | 131 |