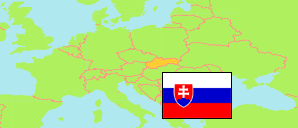
Nitra
District in Slovakia
Contents: Population
The population development of Nitra as well as related information and services (Wikipedia, Google, images).
| Name | Status | Population Census 1991-03-03 | Population Census 2001-05-26 | Population Census 2011-05-21 | Population Census 2021-01-01 | Population Estimate 2023-12-31 | |
|---|---|---|---|---|---|---|---|
| Nitra | District | 160,725 | 163,540 | 159,143 | 164,788 | 164,820 | |
| Slovensko [Slovakia] | Republic | 5,274,335 | 5,379,455 | 5,397,036 | 5,449,270 | 5,424,687 |
Source: Statistical Office of the Slovak Republic.
Further information about the population structure:
| Gender (E 2023) | |
|---|---|
| Males | 80,015 |
| Females | 84,805 |
| Age Groups (E 2023) | |
|---|---|
| 0-17 years | 29,387 |
| 18-64 years | 103,552 |
| 65+ years | 31,881 |
| Age Distribution (E 2023) | |
|---|---|
| 90+ years | 841 |
| 80-89 years | 5,399 |
| 70-79 years | 15,082 |
| 60-69 years | 20,951 |
| 50-59 years | 22,104 |
| 40-49 years | 27,668 |
| 30-39 years | 24,544 |
| 20-29 years | 15,951 |
| 10-19 years | 15,391 |
| 0-9 years | 16,889 |
| Urbanization (C 2021) | |
|---|---|
| Rural | 77,706 |
| Urban | 87,082 |
| Citizenship (C 2021) | |
|---|---|
| Slovakia | 162,907 |
| Foreign Citizenship | 1,827 |
| Country of Birth (C 2021) | |
|---|---|
| Slovakia | 158,489 |
| Other country | 5,812 |
| Ethnic Group (C 2021) | |
|---|---|
| Slovak | 146,728 |
| Hungarian | 6,798 |
| Romani | 136 |
| Ruthenian | 58 |
| Czech | 783 |
| Other ethnic groups | 1,256 |
| Mother Tongue (C 2021) | |
|---|---|
| Slovak | 145,287 |
| Hungarian | 7,513 |
| Romani | 614 |
| Ruthenian | 81 |
| Czech | 931 |
| Other language | 1,257 |
| Religion (C 2021) | |
|---|---|
| Roman Catholic | 106,793 |
| Evangelical Church | 3,446 |
| Greek Catholic | 1,100 |
| Reformed (Calvinists) | 368 |
| Orthodox | 328 |
| Other christian church | 1,825 |
| Other religion | 1,781 |
| No religion | 38,247 |