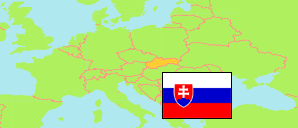
Nitriansky kraj
Region in Slovakia
Contents: Subdivision
The population development in Nitriansky kraj as well as related information and services (Wikipedia, Google, images).
| Name | Status | Population Census 1991-03-03 | Population Census 2001-05-26 | Population Census 2011-05-21 | Population Census 2021-01-01 | Population Estimate 2023-12-31 | |
|---|---|---|---|---|---|---|---|
| Nitriansky kraj [Nitra] | Region | 716,846 | 713,422 | 689,867 | 677,900 | 668,301 | |
| Komárno | District | 109,279 | 108,556 | 103,995 | 100,952 | 99,273 | → |
| Levice | District | 120,703 | 120,021 | 115,367 | 110,469 | 108,479 | → |
| Nitra | District | 160,725 | 163,540 | 159,143 | 164,788 | 164,820 | → |
| Nové Zámky | District | 153,466 | 149,594 | 144,417 | 138,168 | 135,003 | → |
| Šaľa | District | 54,159 | 54,000 | 53,286 | 51,477 | 50,384 | → |
| Topoľčany | District | 74,136 | 74,089 | 72,257 | 70,877 | 69,577 | → |
| Zlaté Moravce | District | 44,378 | 43,622 | 41,402 | 41,169 | 40,765 | → |
| Slovensko [Slovakia] | Republic | 5,274,335 | 5,379,455 | 5,397,036 | 5,449,270 | 5,424,687 |
Source: Statistical Office of the Slovak Republic.
Further information about the population structure:
| Gender (E 2023) | |
|---|---|
| Males | 326,144 |
| Females | 342,157 |
| Age Groups (E 2023) | |
|---|---|
| 0-17 years | 110,979 |
| 18-64 years | 423,352 |
| 65+ years | 133,970 |
| Age Distribution (E 2023) | |
|---|---|
| 90+ years | 3,312 |
| 80-89 years | 22,763 |
| 70-79 years | 62,736 |
| 60-69 years | 90,338 |
| 50-59 years | 95,209 |
| 40-49 years | 111,512 |
| 30-39 years | 93,795 |
| 20-29 years | 65,691 |
| 10-19 years | 61,965 |
| 0-9 years | 60,980 |
| Urbanization (C 2021) | |
|---|---|
| Rural | 369,656 |
| Urban | 308,244 |
| Citizenship (C 2021) | |
|---|---|
| Slovakia | 669,992 |
| Foreign Citizenship | 7,627 |
| Country of Birth (C 2021) | |
|---|---|
| Slovakia | 650,104 |
| Other country | 26,211 |
| Ethnic Group (C 2021) | |
|---|---|
| Slovak | 476,655 |
| Hungarian | 151,213 |
| Romani | 2,630 |
| Ruthenian | 152 |
| Czech | 3,050 |
| Other ethnic groups | 3,989 |
| Mother Tongue (C 2021) | |
|---|---|
| Slovak | 462,859 |
| Hungarian | 161,343 |
| Romani | 3,841 |
| Ruthenian | 218 |
| Czech | 3,397 |
| Other language | 4,050 |
| Religion (C 2021) | |
|---|---|
| Roman Catholics | 413,458 |
| Evangelical Church | 17,825 |
| Greek Catholics | 4,204 |
| Reformed (Calvinists) | 24,210 |
| Orthodox | 975 |
| Other christian church | 8,404 |
| Other religion | 5,507 |
| No religion | 155,832 |
