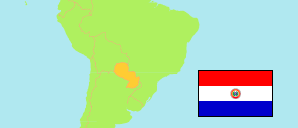
Capiatá
District in Paraguay
Contents: Population
The population development of Capiatá as well as related information and services (Wikipedia, Google, images).
| Name | Status | Population Census 2002-08-28 | Population Census 2022-11-09 | |
|---|---|---|---|---|
| Capiatá | District | 154,274 | 236,999 | |
| Paraguay | Pepublic | 5,163,198 | 6,109,903 |
Source: Paraguay Dirección General de Estadísticas, Encuestas y Censos.
Explanation: Area figures of districts are calculated from geospatial data.
Further information about the population structure:
| Gender (C 2022) | |
|---|---|
| Males | 118,320 |
| Females | 118,679 |
| Age Groups (C 2022) | |
|---|---|
| 0-14 years | 58,451 |
| 15-64 years | 162,507 |
| 65+ years | 16,041 |
| Age Distribution (C 2022) | |
|---|---|
| 90+ years | 434 |
| 80-89 years | 2,348 |
| 70-79 years | 6,706 |
| 60-69 years | 15,414 |
| 50-59 years | 21,970 |
| 40-49 years | 28,776 |
| 30-39 years | 39,825 |
| 20-29 years | 43,637 |
| 10-19 years | 39,304 |
| 0-9 years | 38,585 |
| Urbanization (C 2022) | |
|---|---|
| Urban | 236,999 |
