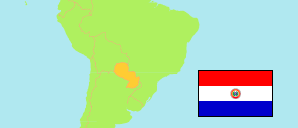
Central
Department in Paraguay
Contents: Subdivision
The population development in Central as well as related information and services (Wikipedia, Google, images).
| Name | Status | Population Census 2002-08-28 | Population Census 2022-11-09 | |
|---|---|---|---|---|
| Central | Department | 1,362,893 | 1,883,927 | |
| Areguá | District | 44,566 | 70,298 | → |
| Capiatá | District | 154,274 | 236,999 | → |
| Fernando de la Mora | District | 113,560 | 110,255 | → |
| Guarambaré | District | 16,687 | 27,695 | → |
| Itá | District | 50,391 | 69,049 | → |
| Itauguá | District | 60,601 | 93,213 | → |
| Julián Augusto Saldívar | District | 37,374 | 60,162 | → |
| Lambaré | District | 119,795 | 127,150 | → |
| Limpio | District | 73,158 | 139,652 | → |
| Luque | District | 185,127 | 259,705 | → |
| Mariano Roque Alonso | District | 65,229 | 85,133 | → |
| Ñemby | District | 71,909 | 116,383 | → |
| Nueva Italia | District | 8,525 | 9,941 | → |
| San Antonio | District | 37,795 | 57,843 | → |
| San Lorenzo | District | 204,356 | 225,395 | → |
| Villa Elisa | District | 53,166 | 71,383 | → |
| Villeta | District | 22,429 | 35,941 | → |
| Ypacaraí | District | 18,530 | 21,030 | → |
| Ypané | District | 25,421 | 66,700 | → |
| Paraguay | Pepublic | 5,163,198 | 6,109,903 |
Source: Paraguay Dirección General de Estadísticas, Encuestas y Censos.
Explanation: Area figures of districts are calculated from geospatial data.
Further information about the population structure:
| Gender (C 2022) | |
|---|---|
| Males | 933,196 |
| Females | 950,731 |
| Age Groups (C 2022) | |
|---|---|
| 0-14 years | 446,973 |
| 15-64 years | 1,289,874 |
| 65+ years | 147,080 |
| Age Distribution (C 2022) | |
|---|---|
| 90+ years | 4,127 |
| 80-89 years | 22,207 |
| 70-79 years | 63,627 |
| 60-69 years | 130,848 |
| 50-59 years | 177,528 |
| 40-49 years | 230,651 |
| 30-39 years | 311,971 |
| 20-29 years | 345,248 |
| 10-19 years | 301,264 |
| 0-9 years | 296,456 |
| Urbanization (C 2022) | |
|---|---|
| Rural | 101,830 |
| Urban | 1,782,097 |
