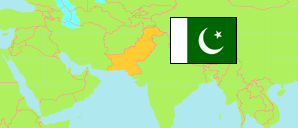
Chiniot
District in Pakistan
Contents: Population
The population development of Chiniot as well as related information and services (Wikipedia, Google, images).
| Name | Status | Population Census 1972-09-16 | Population Census 1981-03-01 | Population Census 1998-03-01 | Population Census 2017-03-15 | Population Census 2023-03-01 | |
|---|---|---|---|---|---|---|---|
| Chiniot | District | 570,775 | 694,080 | 965,124 | 1,368,659 | 1,563,024 | |
| Pakistan | Republic | 65,309,340 | 84,253,644 | 132,352,279 | 207,684,626 | 241,499,431 |
Source: Pakistan Bureau of Statistics, U.S. Bureau of Census: Demobase Pakistan.
Explanation: The Pakistani-administered parts of Kashmir are not tabulated.
Further information about the population structure:
| Gender (C 2017) | |
|---|---|
| Males | 699,606 |
| Females | 668,914 |
| Transgender | 139 |
| Age Groups (C 2017) | |
|---|---|
| 0-14 years | 532,196 |
| 15-64 years | 769,186 |
| 65+ years | 67,277 |
| Age Distribution (C 2017) | |
|---|---|
| 0-9 years | 381,082 |
| 10-19 years | 282,328 |
| 20-29 years | 220,459 |
| 30-39 years | 171,188 |
| 40-49 years | 121,612 |
| 50-59 years | 91,425 |
| 60-69 years | 59,027 |
| 70+ years | 41,538 |
| Urbanization (C 2017) | |
|---|---|
| Rural | 946,429 |
| Urban | 422,230 |
| Literacy (A10+) (C 2017) | |
|---|---|
| yes | 494,286 |
| no | 493,291 |
| Mother Tongue (C 2017) | |
|---|---|
| Urdu | 52,735 |
| Punjabi | 1,295,028 |
| Sindhi | 282 |
| Pushto | 15,890 |
| Balochi | 163 |
| Kashmiri | 127 |
| Saraiki | 2,719 |
| Hindko | 419 |
| Brahvi | 67 |
| Other Language | 1,229 |