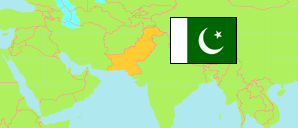
Punjab
Province in Pakistan
Contents: Subdivision
The population development in Punjab as well as related information and services (Wikipedia, Google, images).
| Name | Status | Population Census 1972-09-16 | Population Census 1981-03-01 | Population Census 1998-03-01 | Population Census 2017-03-15 | Population Census 2023-03-01 | |
|---|---|---|---|---|---|---|---|
| Punjab | Province | 37,607,423 | 47,292,441 | 73,621,290 | 109,989,655 | 127,688,922 | |
| Attock | District | 748,890 | 876,667 | 1,274,935 | 1,886,378 | 2,170,423 | → |
| Bahawalnagar | District | 1,073,891 | 1,373,747 | 2,061,447 | 2,975,656 | 3,550,342 | → |
| Bahawalpur | District | 1,071,026 | 1,453,438 | 2,433,091 | 3,669,176 | 4,284,964 | → |
| Bhakkar | District | 500,498 | 665,884 | 1,051,456 | 1,647,852 | 1,957,470 | → |
| Chakwal | District | 692,802 | 775,600 | 1,083,725 | 1,495,463 | 1,734,854 | → |
| Chiniot | District | 570,775 | 694,080 | 965,124 | 1,368,659 | 1,563,024 | → |
| Dera Ghazi Khan | District | 686,057 | 943,663 | 1,643,118 | 2,872,631 | 3,393,705 | → |
| Faisalabad | District | 3,163,756 | 3,561,909 | 5,429,547 | 7,882,444 | 9,075,819 | → |
| Gujranwala | District | 1,615,568 | 2,108,365 | 3,400,940 | 5,011,066 | 5,959,750 | → |
| Gujrat | District | 1,177,345 | 1,408,585 | 2,048,008 | 2,756,289 | 3,219,375 | → |
| Hafizabad | District | 444,187 | 567,572 | 832,980 | 1,156,954 | 1,319,909 | → |
| Jhang | District | 983,818 | 1,276,864 | 1,869,421 | 2,742,633 | 3,077,720 | → |
| Jhelum | District | 591,906 | 659,012 | 936,957 | 1,222,403 | 1,382,308 | → |
| Kasur | District | 1,186,386 | 1,528,002 | 2,354,506 | 3,454,881 | 4,084,286 | → |
| Khanewal | District | 1,067,993 | 1,369,766 | 2,068,490 | 2,920,233 | 3,364,077 | → |
| Khushab | District | 543,314 | 641,366 | 905,711 | 1,280,372 | 1,501,089 | → |
| Lahore | District | 2,587,621 | 3,544,942 | 6,340,114 | 11,119,985 | 13,004,135 | → |
| Layyah | District | 495,537 | 666,517 | 1,120,951 | 1,823,995 | 2,102,386 | → |
| Lodhran | District | 558,793 | 739,912 | 1,171,800 | 1,699,693 | 1,928,299 | → |
| Mandi Bahauddin | District | 721,833 | 846,114 | 1,160,552 | 1,594,039 | 1,829,486 | → |
| Mianwali | District | 595,134 | 711,529 | 1,056,620 | 1,542,601 | 1,798,268 | → |
| Multan | District | 1,506,223 | 1,970,075 | 3,116,851 | 4,746,166 | 5,362,305 | → |
| Muzaffargarh | District | 1,069,358 | 1,497,736 | 2,635,903 | 4,328,549 | 5,015,325 | → |
| Nankana Sahib | District | ... | ... | 1,044,865 | 1,354,986 | 1,634,871 | → |
| Narowal | District | 834,501 | 908,977 | 1,265,097 | 1,707,575 | 1,950,954 | → |
| Okara | District | 1,123,812 | 1,487,261 | 2,232,992 | 3,040,826 | 3,515,490 | → |
| Pakpattan | District | 615,742 | 843,623 | 1,286,680 | 1,824,228 | 2,136,170 | → |
| Rahim Yar Khan | District | 1,398,879 | 1,841,451 | 3,141,053 | 4,807,762 | 5,564,703 | → |
| Rajanpur | District | 456,391 | 638,921 | 1,103,618 | 1,996,039 | 2,381,049 | → |
| Rawalpindi | District | 1,744,949 | 2,121,450 | 3,363,911 | 5,402,380 | 6,118,911 | → |
| Sahiwal | District | 944,656 | 1,281,526 | 1,843,194 | 2,513,011 | 2,881,811 | → |
| Sargodha | District | 1,557,641 | 1,911,849 | 2,665,979 | 3,696,212 | 4,334,448 | → |
| Sheikhupura | District | ... | ... | 2,276,164 | 3,460,004 | 4,049,418 | → |
| Sialkot | District | 1,509,424 | 1,802,505 | 2,723,481 | 3,894,938 | 4,499,394 | → |
| Toba Tek Singh | District | 1,084,442 | 1,134,572 | 1,621,593 | 2,191,495 | 2,511,963 | → |
| Vehari | District | 1,027,319 | 1,328,808 | 2,090,416 | 2,902,081 | 3,430,421 | → |
| Pakistan | Republic | 65,309,340 | 84,253,644 | 132,352,279 | 207,684,626 | 241,499,431 |
Source: Pakistan Bureau of Statistics, U.S. Bureau of Census: Demobase Pakistan.
Explanation: The Pakistani-administered parts of Kashmir are not tabulated.
Further information about the population structure:
| Gender (C 2017) | |
|---|---|
| Males | 55,909,774 |
| Females | 54,067,446 |
| Transgender | 12,435 |
| Age Groups (C 2017) | |
|---|---|
| 0-14 years | 41,796,686 |
| 15-64 years | 63,583,934 |
| 65+ years | 4,609,035 |
| Age Distribution (C 2017) | |
|---|---|
| 0-9 years | 29,229,320 |
| 10-19 years | 23,801,699 |
| 20-29 years | 18,863,453 |
| 30-39 years | 14,302,536 |
| 40-49 years | 9,812,806 |
| 50-59 years | 6,920,094 |
| 60-69 years | 4,154,176 |
| 70+ years | 2,905,571 |
| Urbanization (C 2017) | |
|---|---|
| Rural | 69,442,450 |
| Urban | 40,547,205 |
| Literacy (A10+) (C 2017) | |
|---|---|
| yes | 51,692,022 |
| no | 29,068,313 |
| Mother Tongue (C 2017) | |
|---|---|
| Urdu | 5,354,668 |
| Punjabi | 76,629,082 |
| Sindhi | 169,698 |
| Pushto | 2,178,102 |
| Balochi | 915,904 |
| Kashmiri | 184,032 |
| Saraiki | 22,748,542 |
| Hindko | 646,501 |
| Brahvi | 32,471 |
| Other Language | 1,130,655 |