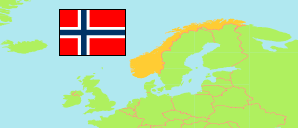
Rogaland
County in Norway
Contents: Subdivision
The population development in Rogaland as well as related information and services (Wikipedia, Google, images).
| Name | Status | Population Estimate 1986-01-01 | Population Estimate 1993-01-01 | Population Estimate 2000-01-01 | Population Estimate 2006-01-01 | Population Estimate 2013-01-01 | Population Estimate 2020-01-01 | Population Estimate 2025-01-01 | |
|---|---|---|---|---|---|---|---|---|---|
| Rogaland | County | 326,421 | 349,787 | 376,497 | 397,594 | 452,159 | 479,892 | 504,496 | |
| Bjerkreim | Municipality | 2,283 | 2,432 | 2,456 | 2,475 | 2,779 | 2,787 | 2,905 | → |
| Bokn | Municipality | 742 | 760 | 786 | 770 | 865 | 852 | 893 | → |
| Eigersund | Municipality | 12,087 | 12,646 | 13,288 | 13,418 | 14,636 | 14,811 | 15,375 | → |
| Gjesdal | Municipality | 6,238 | 7,855 | 8,911 | 9,426 | 11,039 | 12,002 | 12,536 | → |
| Hå | Municipality | 12,715 | 13,041 | 13,921 | 14,883 | 17,635 | 18,991 | 20,067 | → |
| Haugesund | Municipality | 26,883 | 28,436 | 30,362 | 31,738 | 35,753 | 37,357 | 38,441 | → |
| Hjelmeland | Municipality | 2,860 | 2,789 | 2,756 | 2,723 | 2,799 | 2,574 | 2,681 | → |
| Karmøy | Municipality | 34,196 | 35,489 | 36,971 | 37,928 | 41,118 | 42,186 | 43,723 | → |
| Klepp | Municipality | 11,358 | 12,202 | 13,789 | 14,832 | 18,227 | 19,588 | 21,186 | → |
| Kvitsøy | Municipality | 518 | 482 | 523 | 521 | 528 | 517 | 570 | → |
| Lund | Municipality | 3,110 | 3,083 | 3,096 | 3,098 | 3,173 | 3,202 | 3,259 | → |
| Randaberg | Municipality | 6,967 | 7,955 | 8,773 | 9,304 | 10,397 | 11,221 | 11,795 | → |
| Sandnes | Municipality | 41,803 | 47,848 | 54,016 | 60,039 | 71,273 | 79,537 | 84,908 | → |
| Sauda | Municipality | 5,484 | 5,283 | 5,081 | 4,769 | 4,745 | 4,595 | 4,600 | → |
| Sokndal | Municipality | 3,483 | 3,501 | 3,358 | 3,301 | 3,286 | 3,280 | 3,371 | → |
| Sola | Municipality | 14,832 | 16,814 | 18,915 | 20,138 | 24,579 | 27,153 | 29,153 | → |
| Stavanger | Municipality | 100,311 | 106,797 | 114,794 | 121,298 | 136,825 | 143,574 | 150,123 | → |
| Strand | Municipality | 9,059 | 9,584 | 10,122 | 10,566 | 11,882 | 12,968 | 13,813 | → |
| Suldal | Municipality | 4,410 | 4,114 | 4,043 | 3,883 | 3,872 | 3,804 | 3,939 | → |
| Time | Municipality | 11,182 | 12,331 | 13,317 | 14,807 | 17,437 | 18,916 | 20,157 | → |
| Tysvær | Municipality | 7,613 | 8,023 | 8,828 | 9,349 | 10,487 | 11,065 | 11,715 | → |
| Utsira | Municipality | 252 | 222 | 256 | 209 | 209 | 198 | 217 | → |
| Vindafjord | Municipality | 8,035 | 8,100 | 8,135 | 8,119 | 8,615 | 8,714 | 9,069 | → |
| Norge (Noreg) [Norway] | Kingdom | 4,159,187 | 4,299,167 | 4,478,497 | 4,640,219 | 5,051,275 | 5,367,580 | 5,594,340 |
Source: Statistics Norway.
Explanation: Counties according to the reestablishment of former counties by 1 January 2024.
Further information about the population structure:
| Gender (E 2025) | |
|---|---|
| Males | 255,984 |
| Females | 248,512 |
| Age Groups (E 2025) | |
|---|---|
| 0-17 years | 112,194 |
| 18-64 years | 308,830 |
| 65+ years | 83,472 |
| Age Distribution (E 2025) | |
|---|---|
| 90+ years | 3,398 |
| 80-89 years | 17,087 |
| 70-79 years | 38,409 |
| 60-69 years | 52,466 |
| 50-59 years | 65,271 |
| 40-49 years | 69,652 |
| 30-39 years | 71,166 |
| 20-29 years | 61,782 |
| 10-19 years | 67,046 |
| 0-9 years | 58,219 |
| Citizenship (E 2025) | |
|---|---|
| Norway | 440,265 |
| Foreign Citizenship | 64,231 |
| Country of Birth (E 2025) | |
|---|---|
| Norway | 407,880 |
| Europe | 53,514 |
| Africa | 9,291 |
| Asia | 26,701 |
| Other country | 7,110 |