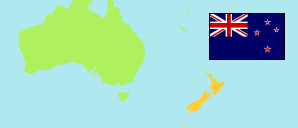
Mataura
in Southland (South Island)
Contents: Small Urban Area
The population development of Mataura as well as related information and services (weather, Wikipedia, Google, images).
| Name | Region | Population Estimate 1996-06-30 | Population Estimate 2001-06-30 | Population Estimate 2006-06-30 | Population Estimate 2013-06-30 | Population Estimate 2018-06-30 | Population Estimate 2022-06-30 | |
|---|---|---|---|---|---|---|---|---|
| Mataura | Southland | 1,990 | 1,790 | 1,610 | 1,560 | 1,700 | 1,720 | → |
Source: Statistics New Zealand / Te Tari Tatau (web).
Explanation: Settlements in 2022 boundaries. Population estimates for 2018 and later are based on the results of the 2018 census. The 2022 figures are provisional.
Further information about the population structure:
| Gender (E 2022) | |
|---|---|
| Males | 850 |
| Females | 870 |
| Age Groups (E 2022) | |
|---|---|
| 0-14 years | 320 |
| 15-64 years | 1,080 |
| 65+ years | 320 |
| Age Distribution (E 2022) | |
|---|---|
| 90+ years | 5 |
| 80-89 years | 60 |
| 70-79 years | 150 |
| 60-69 years | 225 |
| 50-59 years | 255 |
| 40-49 years | 190 |
| 30-39 years | 215 |
| 20-29 years | 220 |
| 10-19 years | 195 |
| 0-9 years | 205 |
| Religion (C 2018) | |
|---|---|
| Anglican | 69 |
| Catholic | 135 |
| Presbyterian | 168 |
| Other Christian | 168 |
| Maori Beliefs | 33 |
| Muslim | 12 |
| Other religion | 18 |
| No religion | 918 |
| Country of Birth (C 2018) | |
|---|---|
| New Zealand | 1,176 |
| Oceania | 21 |
| Europe | 45 |
| Asia | 24 |
| Other country | 3 |
| Ethnic Group (C 2018) | |
|---|---|
| European | 1,230 |
| Maori | 513 |
| Pacific | 45 |
| Asian | 36 |
| Other group | 36 |