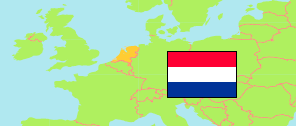
Harderwijk
Municipality in Gelderland (Netherlands)
Contents: Population
The population development of Harderwijk as well as related information and services (Wikipedia, Google, images).
| Name | Status | Population Census 2001-01-01 | Population Estimate 2008-01-01 | Population Estimate 2011-01-01 | Population Estimate 2018-01-01 | Population Estimate 2024-01-01 | |
|---|---|---|---|---|---|---|---|
| Harderwijk | Municipality | 40,183 | 42,333 | 44,932 | 46,832 | 49,378 | |
| Nederland [Netherlands] | Country | 15,985,538 | 16,405,399 | 16,655,799 | 17,181,084 | 17,947,684 |
Source: Statistics Netherlands.
Explanation: Provinces and municipalities in the boundaries of 1 January 2024. 2024 population figures are preliminary.
Further information about the population structure:
| Gender (E 2023) | |
|---|---|
| Males | 24,246 |
| Females | 24,660 |
| Age Groups (E 2023) | |
|---|---|
| 0-17 years | 10,150 |
| 18-64 years | 29,216 |
| 65+ years | 9,540 |
| Age Distribution (E 2023) | |
|---|---|
| 90+ years | 349 |
| 80-89 years | 1,894 |
| 70-79 years | 4,504 |
| 60-69 years | 5,895 |
| 50-59 years | 6,973 |
| 40-49 years | 6,266 |
| 30-39 years | 6,203 |
| 20-29 years | 5,457 |
| 10-19 years | 6,026 |
| 0-9 years | 5,339 |
| Urbanization (E 2023) | |
|---|---|
| Highly urbanized | 3,740 |
| Strongly urbanized | 19,860 |
| Moderately urbanized | 17,850 |
| Lowly urbanized | 3,840 |
| Rural | 3,610 |
| Citizenhip (E 2023) | |
|---|---|
| Netherlands | 46,604 |
| European Union | 882 |
| Europe (Rest) | 183 |
| Other country | 1,237 |
| Birth Country (E 2023) | |
|---|---|
| Netherlands | 43,597 |
| Other country | 5,309 |