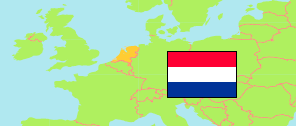
Overijssel
Province in Netherlands
Contents: Subdivision
The population development in Overijssel as well as related information and services (Wikipedia, Google, images).
| Name | Status | Population Census 2001-01-01 | Population Estimate 2008-01-01 | Population Estimate 2011-01-01 | Population Estimate 2018-01-01 | Population Estimate 2024-01-01 | |
|---|---|---|---|---|---|---|---|
| Overijssel | Province | 1,086,063 | 1,119,994 | 1,134,465 | 1,151,501 | 1,189,079 | |
| Almelo | Municipality | 70,378 | 72,287 | 72,599 | 72,629 | 74,355 | → |
| Borne | Municipality | 20,717 | 20,764 | 21,557 | 23,124 | 24,632 | → |
| Dalfsen | Municipality | 25,830 | 26,735 | 27,313 | 28,242 | 29,684 | → |
| Deventer | Municipality | 90,232 | 97,342 | 98,737 | 99,653 | 103,402 | → |
| Dinkelland | Municipality | 25,973 | 26,116 | 26,067 | 26,291 | 26,741 | → |
| Enschede | Municipality | 150,447 | 154,753 | 157,838 | 158,261 | 161,741 | → |
| Haaksbergen | Municipality | 24,129 | 24,378 | 24,448 | 24,291 | 24,360 | → |
| Hardenberg | Municipality | 57,219 | 58,207 | 59,283 | 60,539 | 62,935 | → |
| Hellendoorn | Municipality | 35,789 | 36,059 | 35,747 | 35,796 | 36,271 | → |
| Hengelo (O.) | Municipality | 80,409 | 81,088 | 80,747 | 80,593 | 83,051 | → |
| Hof van Twente | Municipality | 34,847 | 35,181 | 35,573 | 34,930 | 35,438 | → |
| Kampen | Municipality | 47,936 | 49,385 | 50,403 | 53,259 | 56,186 | → |
| Losser | Municipality | 22,756 | 22,492 | 22,664 | 22,547 | 23,380 | → |
| Oldenzaal | Municipality | 31,110 | 31,584 | 32,176 | 31,915 | 31,794 | → |
| Olst-Wijhe | Municipality | 17,022 | 17,334 | 17,502 | 18,023 | 18,843 | → |
| Ommen | Municipality | 16,771 | 17,419 | 17,329 | 17,630 | 19,035 | → |
| Raalte | Municipality | 36,402 | 37,030 | 36,688 | 37,158 | 38,364 | → |
| Rijssen-Holten | Municipality | 35,399 | 36,667 | 37,433 | 38,097 | 38,676 | → |
| Staphorst | Municipality | 15,328 | 15,973 | 16,179 | 16,797 | 17,738 | → |
| Steenwijkerland | Municipality | 41,171 | 43,282 | 43,281 | 43,768 | 45,480 | → |
| Tubbergen | Municipality | 20,021 | 20,797 | 21,171 | 21,213 | 21,393 | → |
| Twenterand | Municipality | 33,322 | 33,461 | 33,727 | 33,903 | 34,071 | → |
| Wierden | Municipality | 23,414 | 23,365 | 23,630 | 24,258 | 24,929 | → |
| Zwartewaterland | Municipality | 22,079 | 21,930 | 22,018 | 22,468 | 23,447 | → |
| Zwolle | Municipality | 107,362 | 116,365 | 120,355 | 126,116 | 133,133 | → |
| Nederland [Netherlands] | Country | 15,985,538 | 16,405,399 | 16,655,799 | 17,181,084 | 17,947,684 |
Source: Statistics Netherlands.
Explanation: Provinces and municipalities in the boundaries of 1 January 2024. 2024 population figures are preliminary.
Further information about the population structure:
| Gender (E 2023) | |
|---|---|
| Males | 594,954 |
| Females | 589,379 |
| Age Groups (E 2023) | |
|---|---|
| 0-17 years | 230,593 |
| 18-64 years | 712,785 |
| 65+ years | 240,955 |
| Age Distribution (E 2023) | |
|---|---|
| 90+ years | 9,046 |
| 80-89 years | 50,000 |
| 70-79 years | 112,840 |
| 60-69 years | 147,381 |
| 50-59 years | 169,377 |
| 40-49 years | 139,634 |
| 30-39 years | 141,631 |
| 20-29 years | 152,449 |
| 10-19 years | 142,508 |
| 0-9 years | 119,467 |
| Urbanization (E 2023) | |
|---|---|
| Highly urbanized | 151,340 |
| Strongly urbanized | 270,630 |
| Moderately urbanized | 223,260 |
| Lowly urbanized | 275,460 |
| Rural | 263,640 |
| Citizenhip (E 2023) | |
|---|---|
| Netherlands | 1,133,260 |
| European Union | 20,091 |
| Europe (Rest) | 8,168 |
| Other country | 22,814 |
| Birth Country (E 2023) | |
|---|---|
| Netherlands | 1,068,995 |
| Other country | 115,338 |