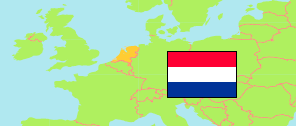
Groningen
Province in Netherlands
Contents: Subdivision
The population development in Groningen as well as related information and services (Wikipedia, Google, images).
| Name | Status | Population Census 2001-01-01 | Population Estimate 2011-01-01 | Population Estimate 2016-01-01 | Population Estimate 2021-01-01 | Population Estimate 2024-01-01 | |
|---|---|---|---|---|---|---|---|
| Groningen | Province | 566,468 | 579,036 | 583,721 | 586,937 | 601,347 | |
| Eemsdelta (incl. Delfzijl, Appingedam, Loppersum) | Municipality | 52,439 | 49,135 | 47,111 | 45,587 | 45,106 | → |
| Groningen (incl. Haren, Ten Boer) | Municipality | 200,402 | 215,960 | 227,380 | 233,273 | 243,768 | → |
| Het Hogeland (incl. Bedum, De Marne, Eemsmond, Winsum) | Municipality | 50,841 | 49,737 | 48,427 | 47,834 | 48,224 | → |
| Midden-Groningen | Municipality | 60,684 | 62,745 | 62,108 | 60,726 | 61,433 | → |
| Oldambt | Municipality | 40,168 | 39,396 | 38,228 | 38,277 | 39,405 | → |
| Pekela | Municipality | 13,359 | 12,954 | 12,641 | 12,176 | 12,517 | → |
| Stadskanaal | Municipality | 33,517 | 33,122 | 32,621 | 31,754 | 32,013 | → |
| Veendam | Municipality | 28,328 | 27,981 | 27,467 | 27,417 | 27,520 | → |
| Westerkwartier (incl. Grootegast, Leek, Marum, Zuidhorn) | Municipality | 60,579 | 62,314 | 62,345 | 63,678 | 64,896 | → |
| Westerwolde (incl. Vlagtwedde, Bellingwedde) | Municipality | 26,151 | 25,692 | 25,393 | 26,215 | 26,465 | → |
| Nederland [Netherlands] | Country | 15,985,538 | 16,655,799 | 16,979,120 | 17,475,415 | 17,942,942 |
Source: Statistics Netherlands.
Explanation: Provinces and municipalities in the boundaries of 1 January 2024. Municipalities of the Caribbean Netherlands are not included. The land area is tabulated.
Further information about the population structure:
| Gender (E 2024) | |
|---|---|
| Males | 300,286 |
| Females | 301,061 |
| Age Groups (E 2024) | |
|---|---|
| 0-17 years | 98,226 |
| 18-64 years | 377,173 |
| 65+ years | 125,948 |
| Age Distribution (E 2024) | |
|---|---|
| 90+ years | 4,526 |
| 80-89 years | 25,442 |
| 70-79 years | 60,066 |
| 60-69 years | 75,255 |
| 50-59 years | 80,664 |
| 40-49 years | 64,452 |
| 30-39 years | 72,216 |
| 20-29 years | 102,627 |
| 10-19 years | 64,818 |
| 0-9 years | 51,281 |
| Urbanization (E 2023) | |
|---|---|
| Highly urbanized | 133,300 |
| Strongly urbanized | 65,000 |
| Moderately urbanized | 83,090 |
| Lowly urbanized | 115,390 |
| Rural | 199,280 |
| Citizenhip (E 2024) | |
|---|---|
| Netherlands | 558,791 |
| European Union | 19,405 |
| Europe (Rest) | 6,001 |
| Other country | 17,150 |
| Birth Country (E 2023) | |
|---|---|
| Netherlands | 524,864 |
| Other country | 71,211 |